Bullish Structures Persist – EXK Example
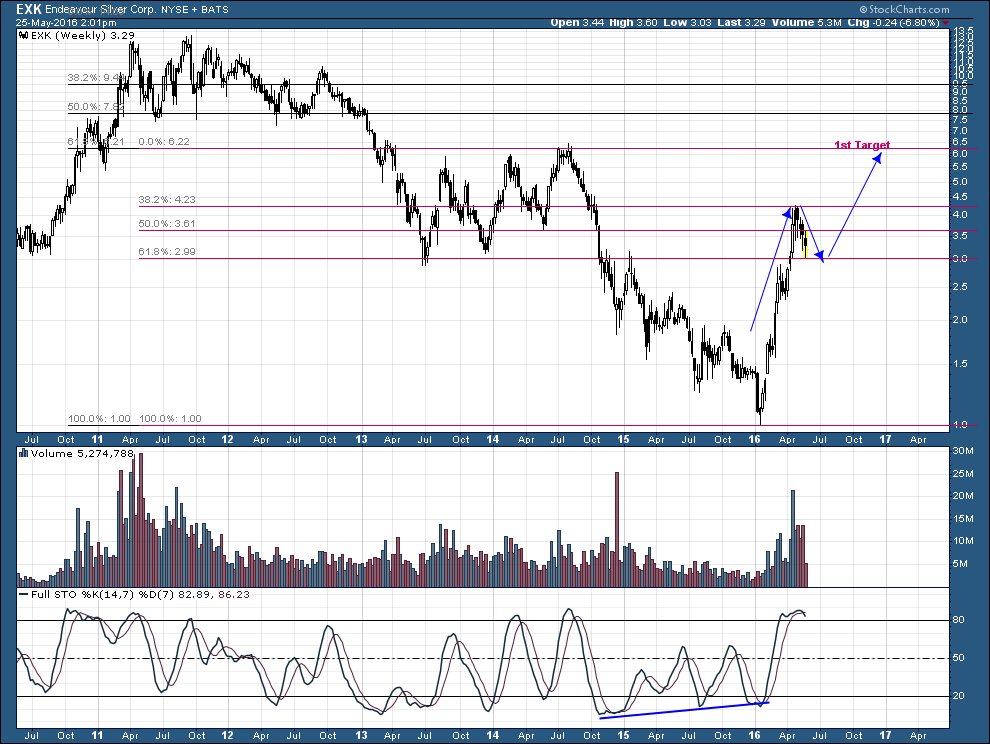
So I’m going through may charts today and watching all my key fibs and 50MAs hold beautifully….so far. In fact, if you’re willing to take a step back in view, this is very healthy structure and exactly what any long term investor would want to see out of the PM sector. EXK daily and weekly charts show this very well. Note on the weekly chart the bounces between the fibs EXACTLY as you would expect in a long term bullish move. If there were no backtesting within the fib levels and retesting of resistance as new support, that would give me greater concern that the new trend was unsustainable. This trend is gaining all the hallmarks of a sustainable trend for the long haul. My average cost on EXK is less than $1.40 and I’ve sold none….in fact, I’ve sold none of my PMs all year and have been simply adding on dips like we’ve been seeing over the past few days. Yes, I didn’t buy all the dips on the exact swing low but no one can. I felt lucky to have added more yesterday at $3.15. I hope not too many of you got your pockets picked on the initial takedown this morning.
This is what you do in an uptrend…..you buy your initial position at a good risk/reward low as the trend is turning and then add on the dips. Guys like Gary Savage would have you believe a strategy like this is moronic. There are nothing wrong with these charts technically….as well as so many others across the PM complex….including the GDX and HUI which I will post later.
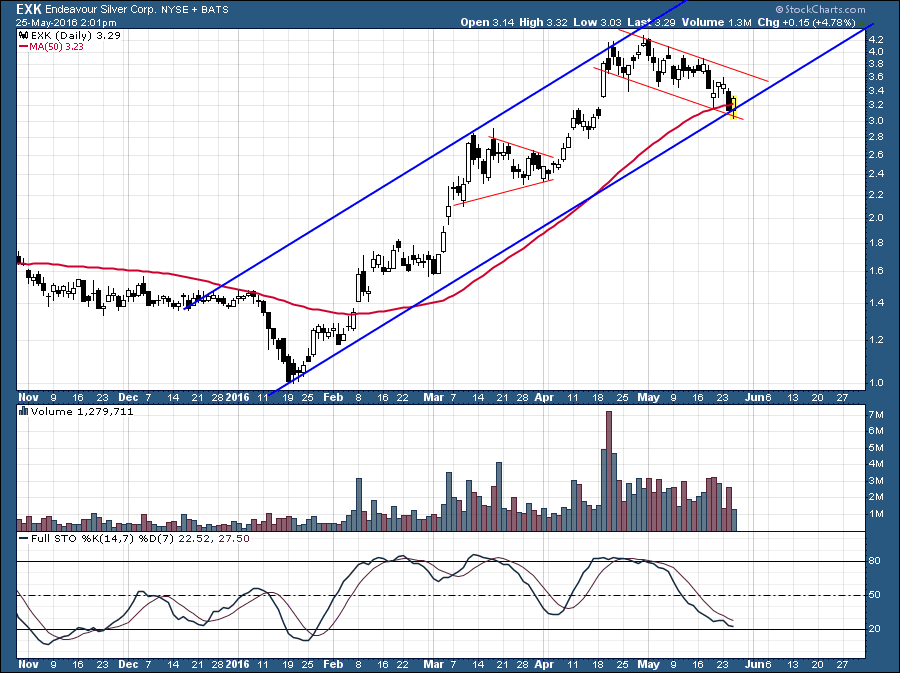
That is what I am seeing also, many are BT and holding MA50, so far.
On EXK/EDR which is one of my core positions too:
https://goldtadise.com/?p=367495
Mark, Great charts and price channels as always.