Gann 7 Year Gold Fractal
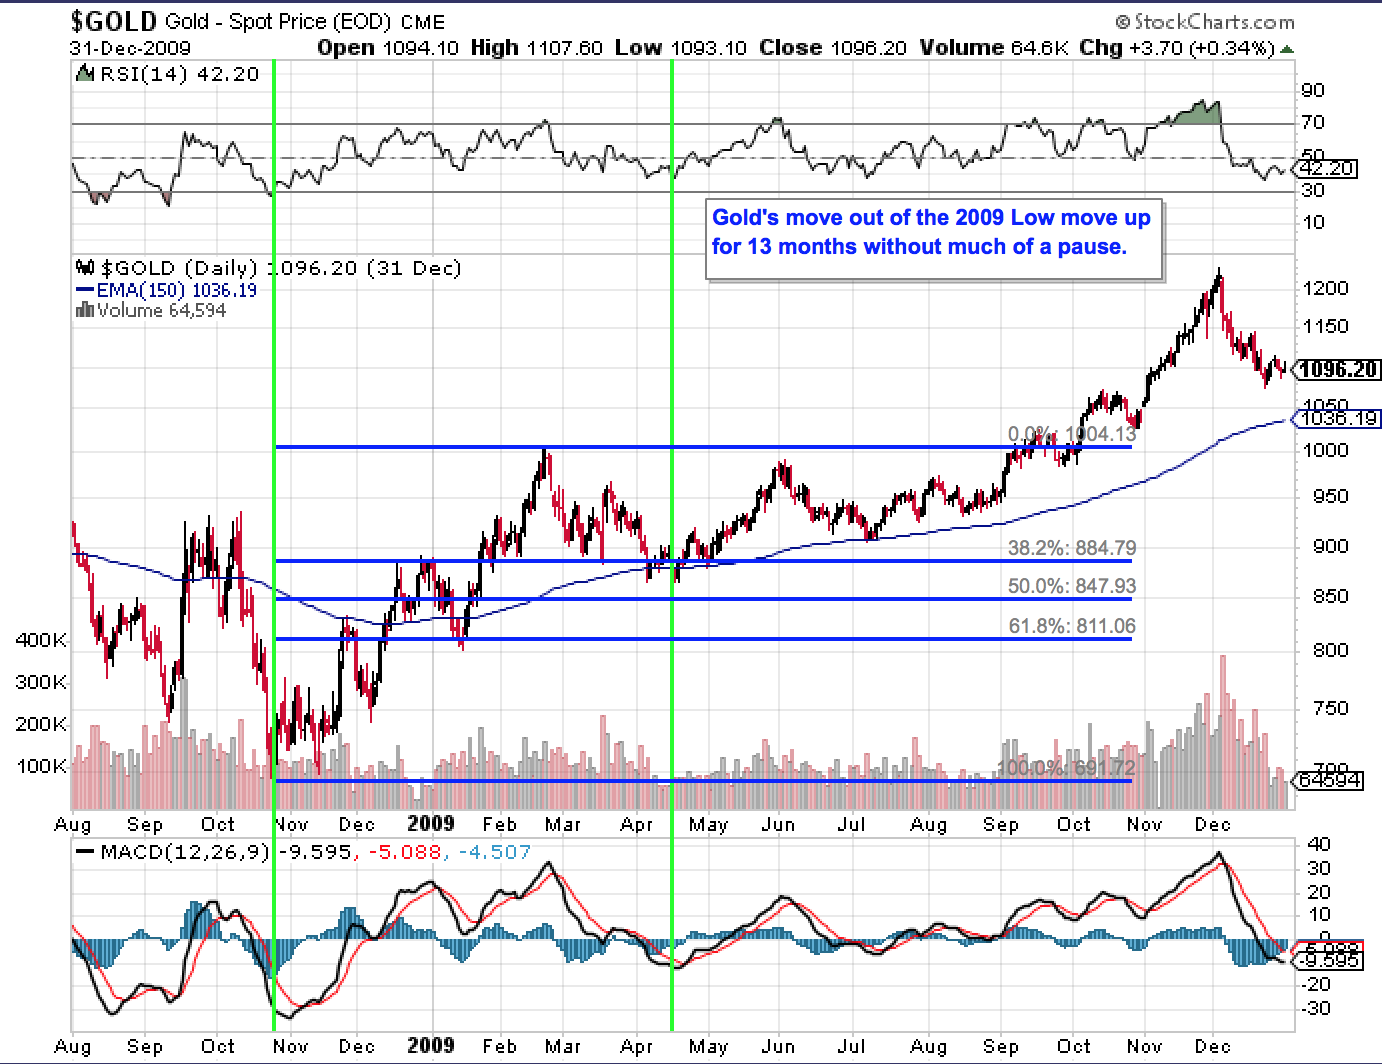
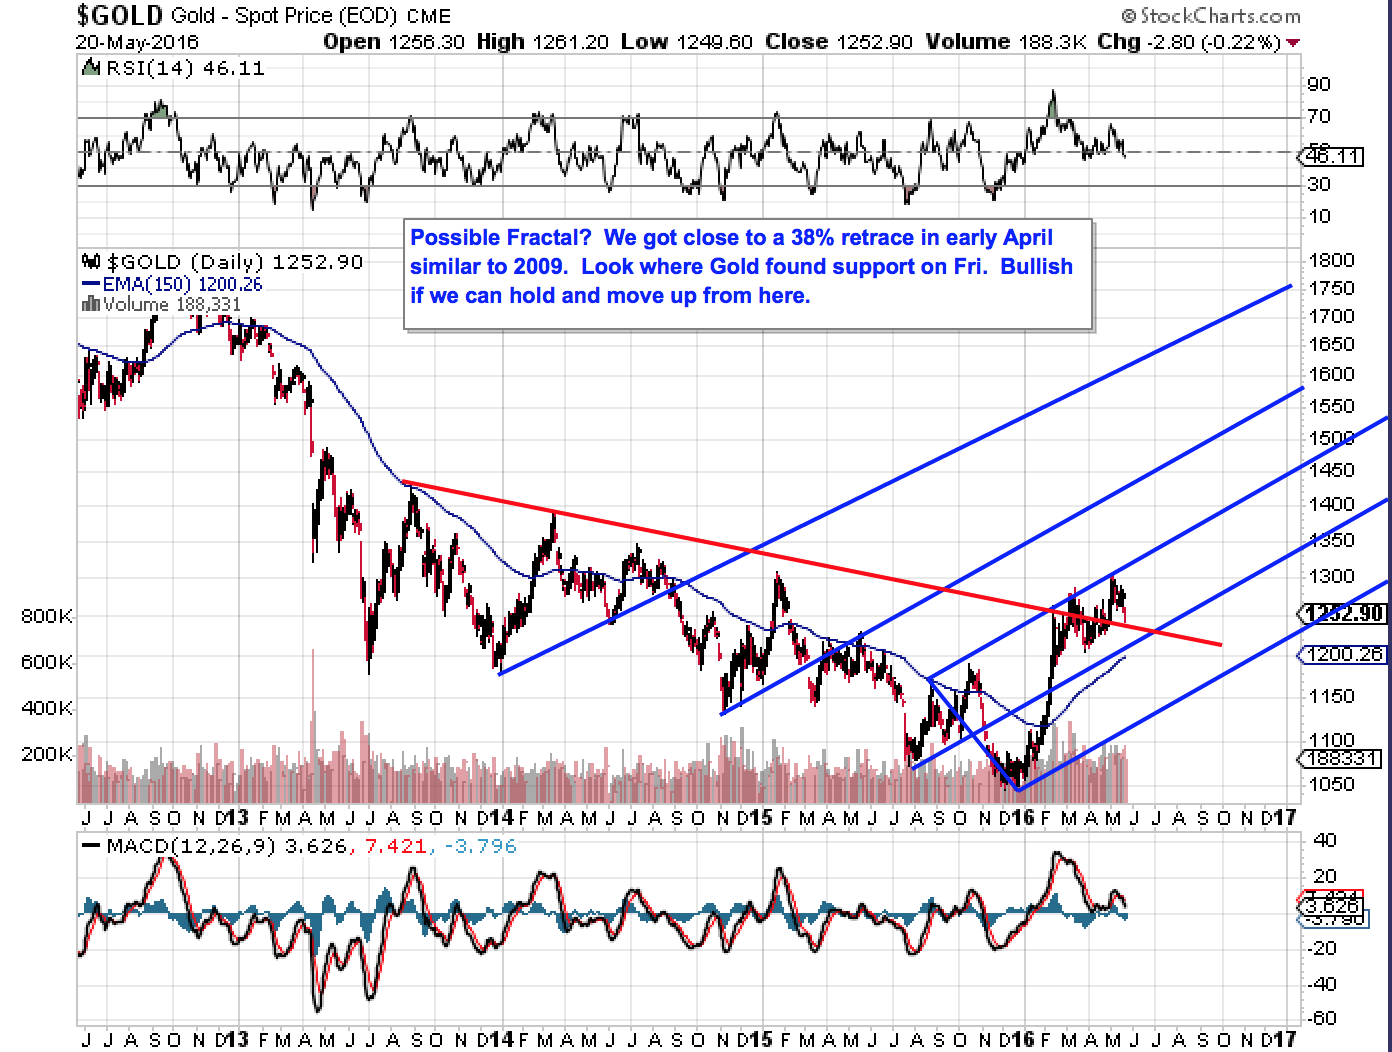
WD Gann felt that 7 was a very important number. With that in mind, lets take a looks at Gold’s move out of the 2009 low. My second green horizontal line shows about where we are from a Time perspective with respect to this fractal. Second Gold chart shows todays Gold Bull and extends Time out to year end or about where the 2009 Fractal top would play out.
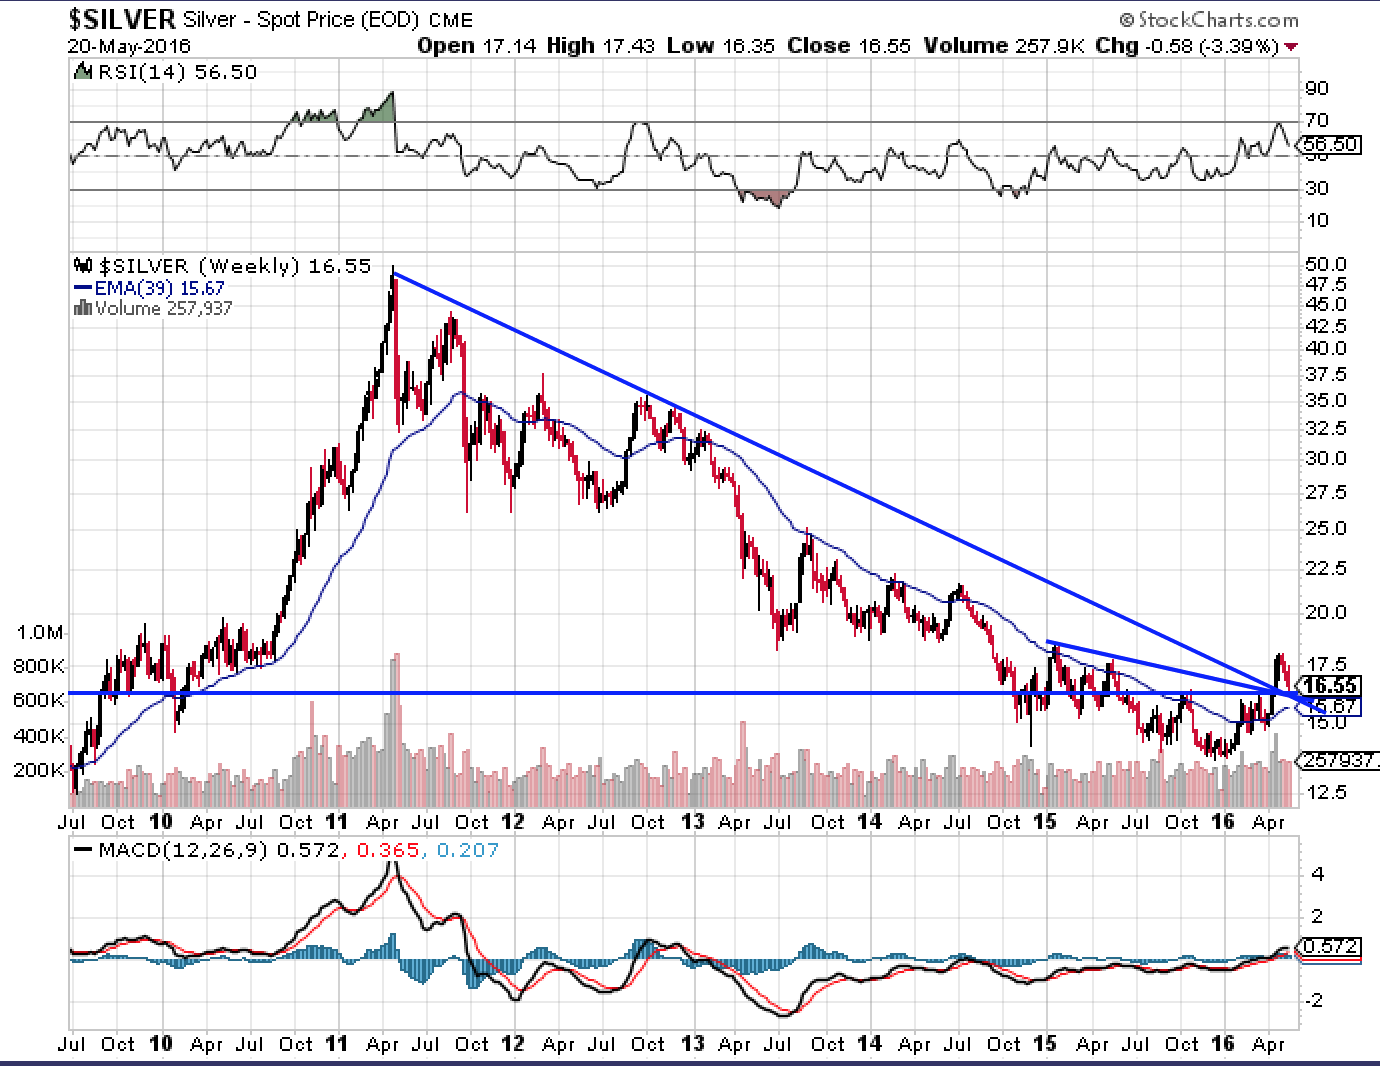
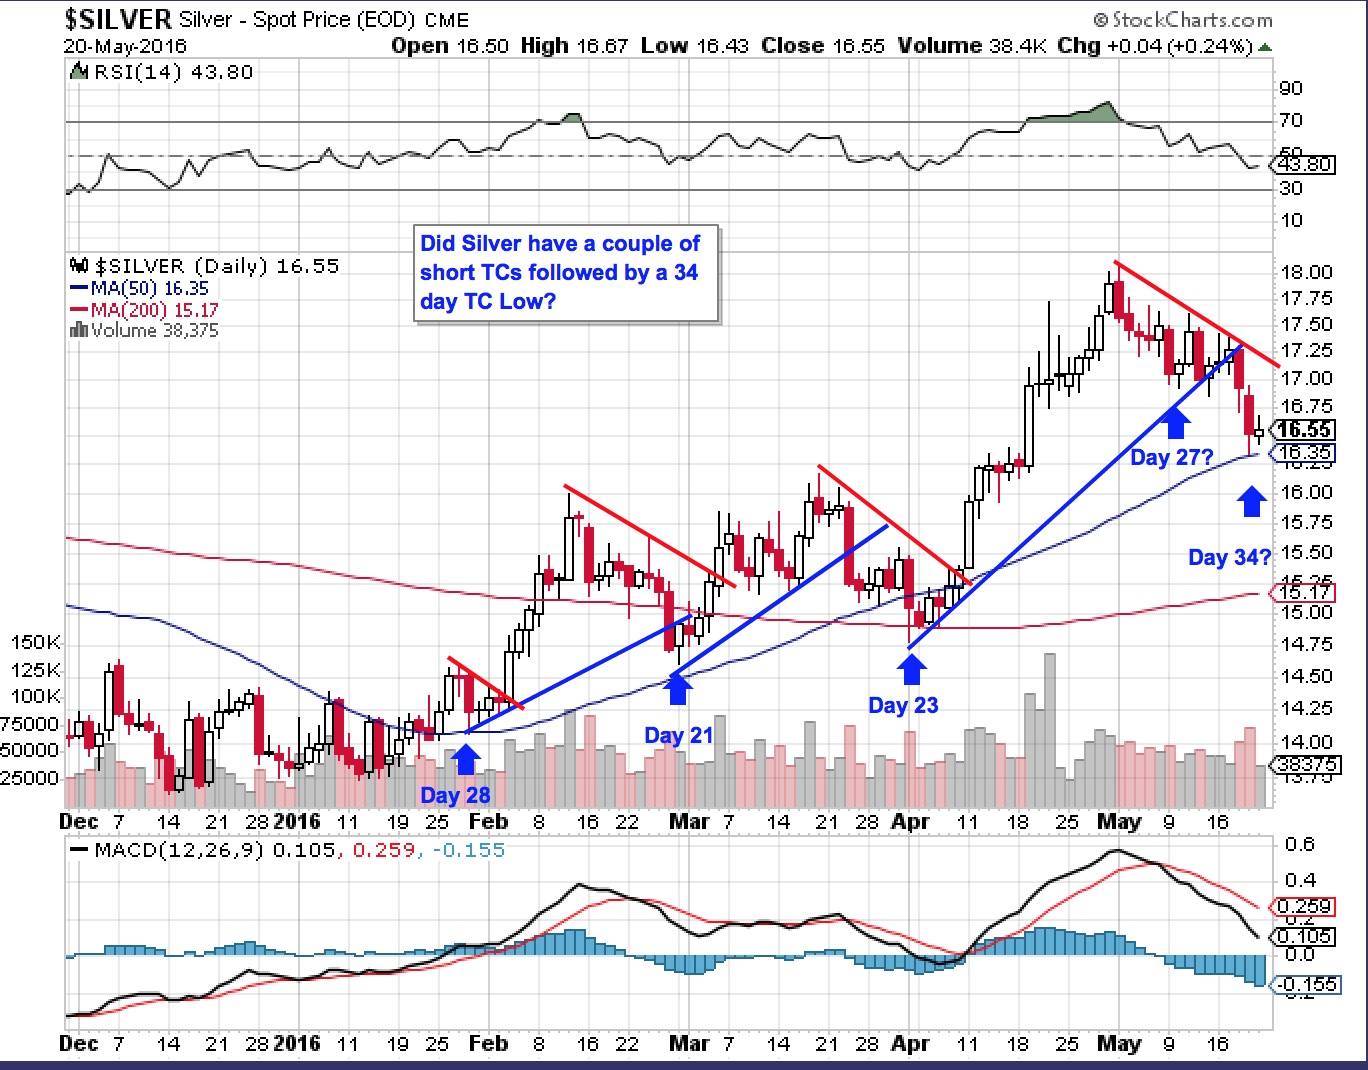
Also here are some interesting charts on Silver’s current move. My first long term chart shows Silver is now sitting on triple support. Usually Bull Markets do not have failed breakouts. Second Silver chart is near term. I don’t normally track Silver separately from Gold so this is just a quick and dirty analysis.