USD Cycle Update
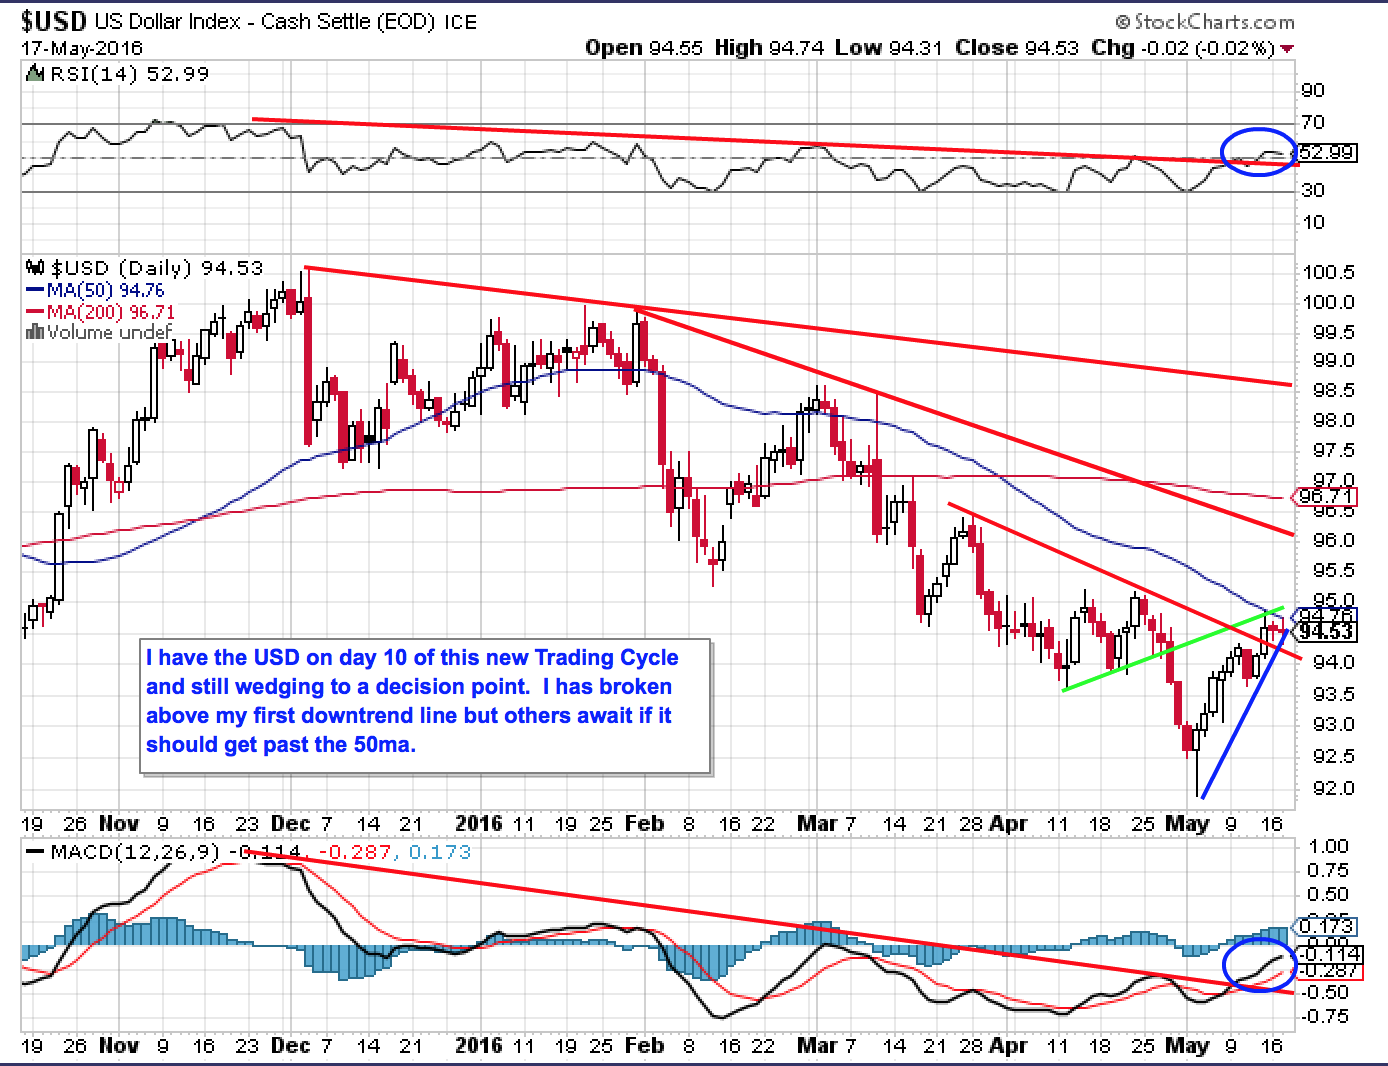
Near term, I have the USD on day 10 of its current Trading Cycle (18-24 days low to low on ave.). My first chart shows the close up price action and Cycle resistance lines. Even if the USD moves up to test the next red line or the 150ema on the daily, my second chart should convince you to keep your “seat on the Gold bus” so to speak.
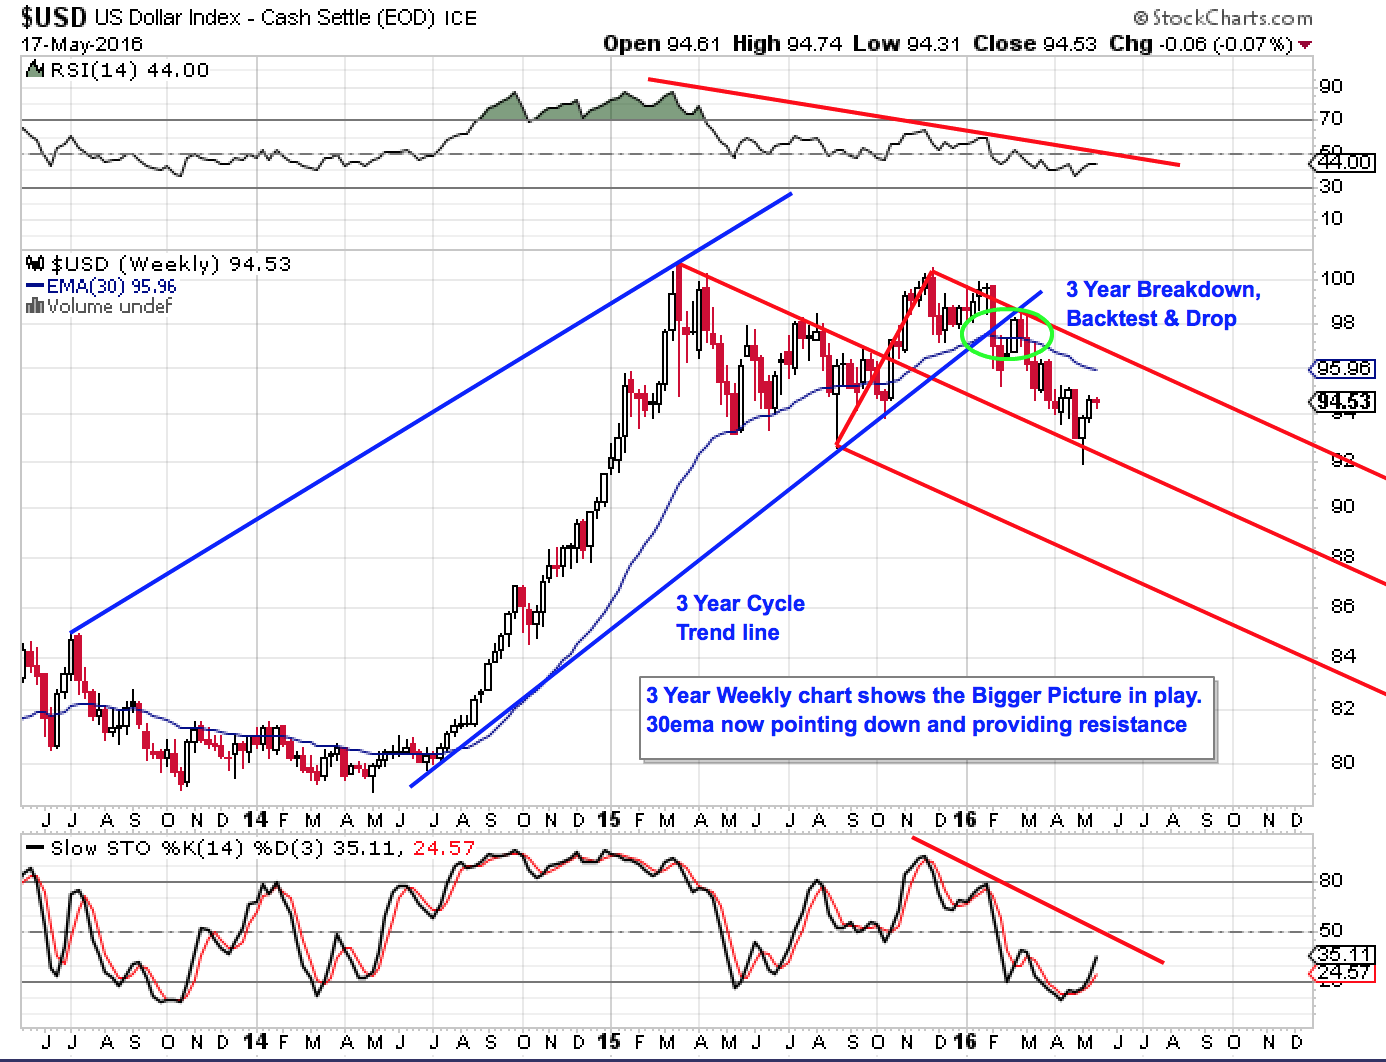
My second chart shows the bigger picture and why Gold, Silver and the Miners have started a new Bull Market. The USD’s 3 year Cycle has topped and very likely, the 15 year cycle as well.
If you trade Futures, I also see many signs in my charts that Soft Commodities (e.g. Soybeans, Grains, Sugar, Coco and Coffee) have started to turn their longer cycles up as well.