Gold Intermediate Cycle
(Note: I made this post last weekend on the Rambus Forum and did not get a chance to post here until now)
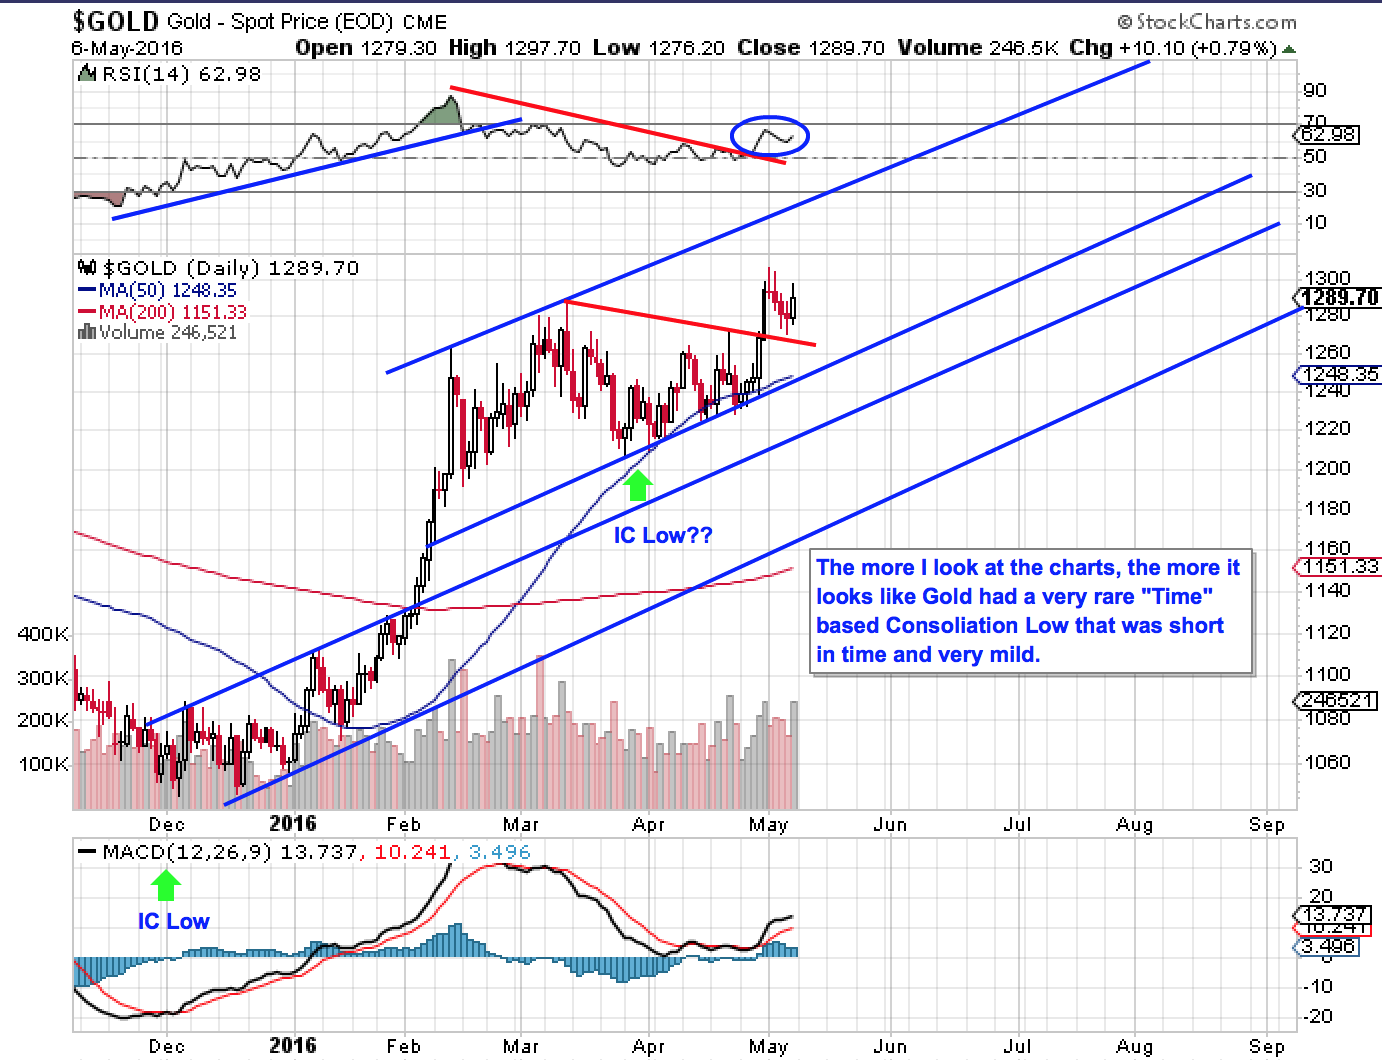
Unlike some Gold Guru’s, I am not going to “guarantee” anything, but it sure looks to me that Gold has made an extremely rare “Time Based” Consolidation Intermediate Cycle (IC) Low in the late March to early April timeframe right near 5 months.
https://goldtadise.com/?p=368426
Gold’s Intermediate Cycles’s last 5-6 months in length (similar to many assets) as this seems to be the time that investor sentiment normally needs to swing between optimistic to pessimistic outlooks. As we all know, however these are not normal times…
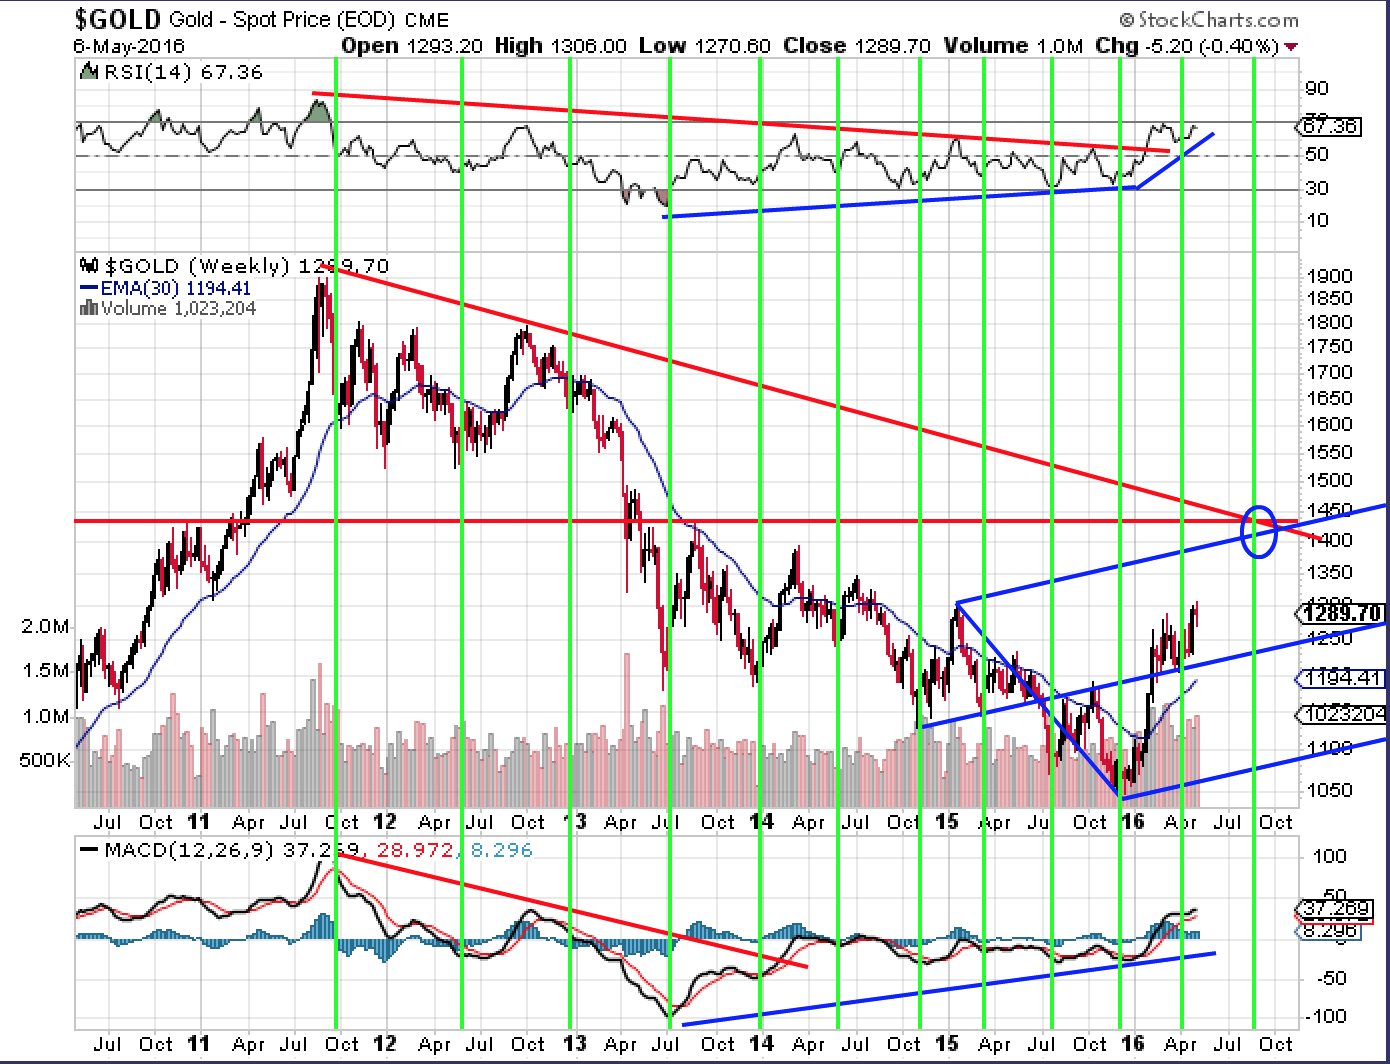
The second chart is a 6 Year weekly that shows this 5-6 month pattern clearly with my Green vertical lines. Note that in 2011-12 we had the 6 month Bullish periods, and over the last 1+ years of Bearish periods a shorter cycle (5 months). We are now at 6 months from Gold’s early Dec 2015 IC Low, and my first chart shows that we have broken to the upside of the Red IC Downtrend line. We have a key trend line break within the normal Time band, so I believe we are in a new Intermediate Cycle here and we should continue to make new highs.
A number of paid Cycle newsletters are still expecting Gold and the Miners to roll over here into the next IC Low in the May/June timeframe because their trend lines, that they rely on, have not been broken. They may well be correct, however, I am lining up with Plunger’s deep and detailed analysis on early Phase 1 Bull markets that shows that pullbacks are mild and short in duration. You can also reference the USD’s rise in 2014 and the move by TLT in early 2014 as other Bull moves that had very mild pullbacks in the first 10+ months
My expectations are that when the Guru’s are looking for the next IC Low, Gold and the Miners will be making new highs.
As always, Time will Tell. 😉
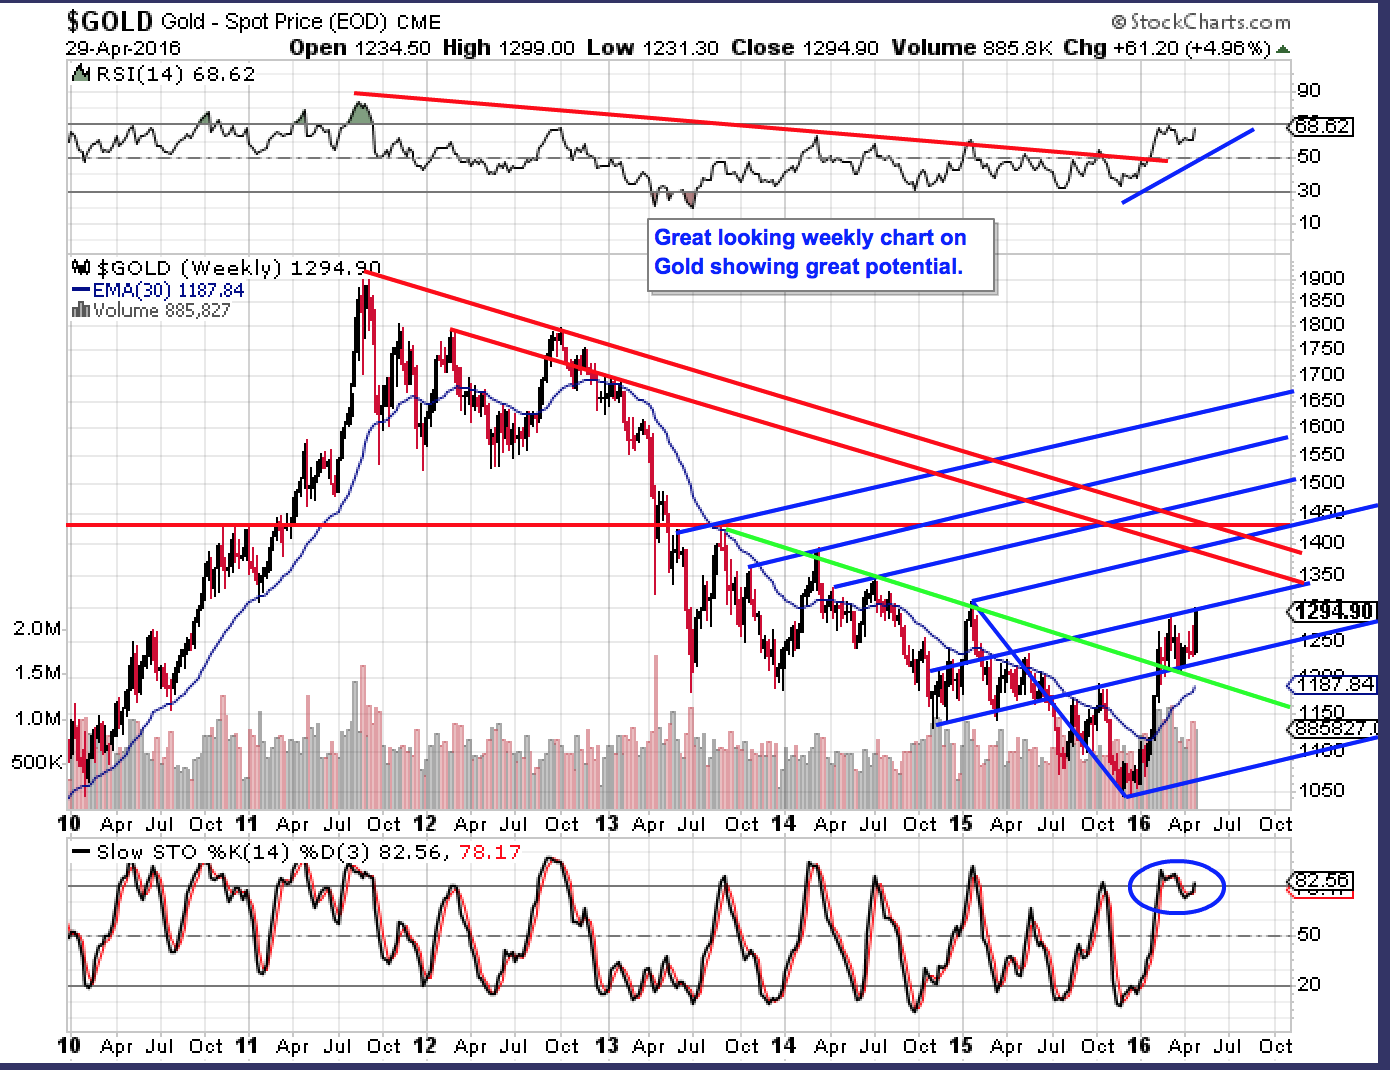
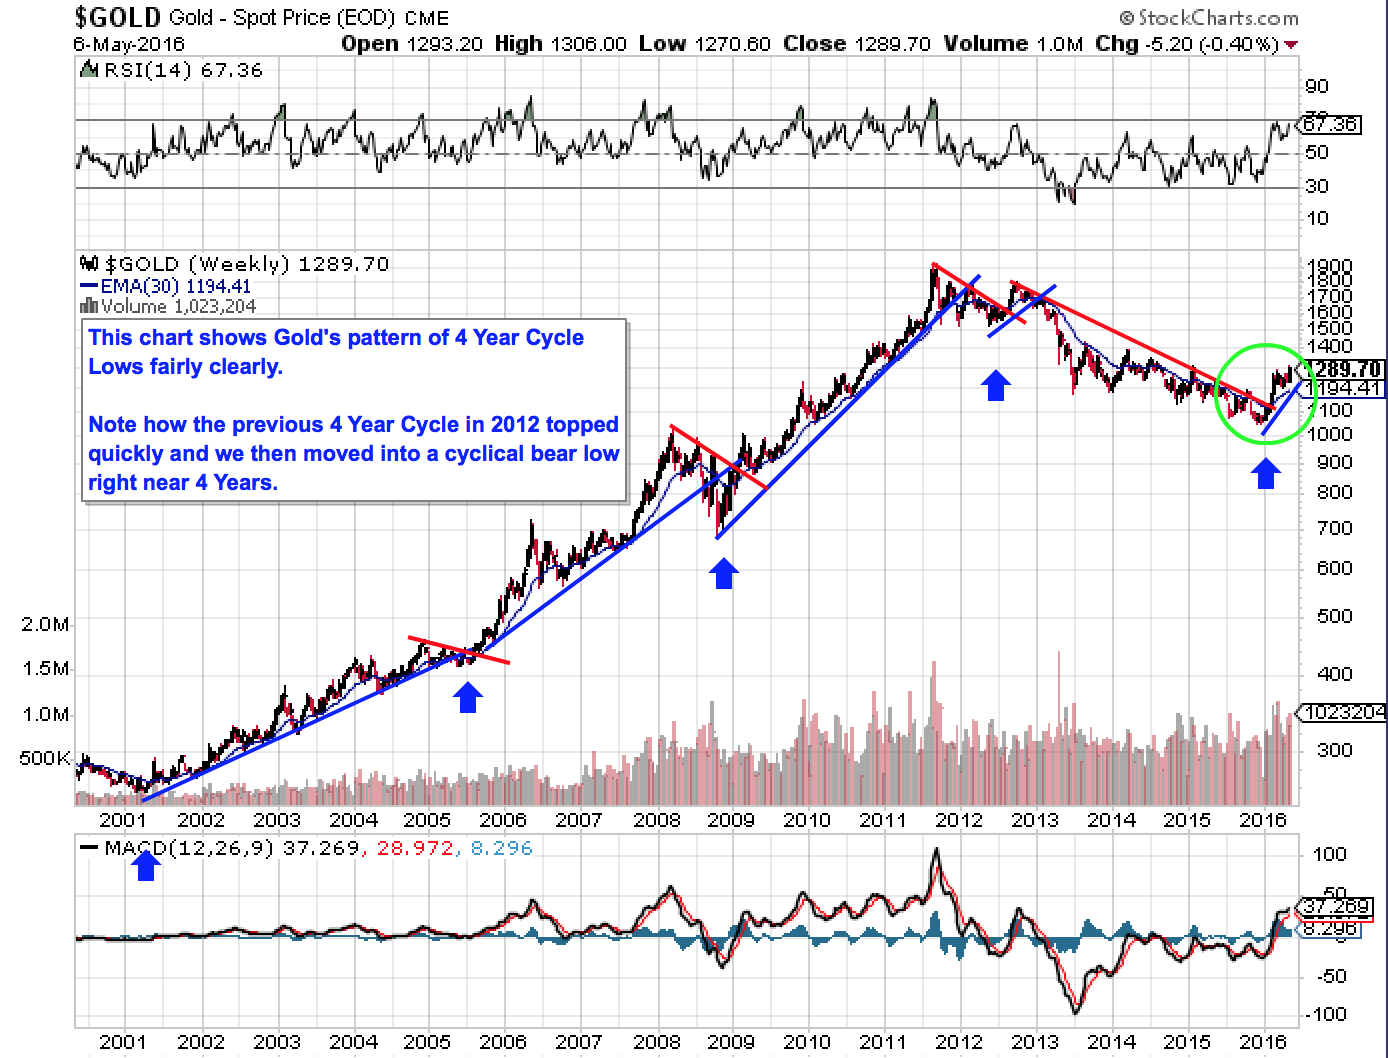
Here are two extra charts that show Gold’s potential price channel longer term and Gold’s 4 Year Cycle. If the Bull has resumed, as we suspect, I would assume the next 3 years should be up for starters. Here is what I see in terms of uptrends and overhead resistance. Second chart shows Gold’s longer 4 Year Cycle (low to low).
Excellent!
Surf, I don’t always comment but I want you to know that your work is always perused and very much appreciated!! Thank you!
I second that!
Your second chart has my favourite pitchfork on it to watch. The upper target of that was approaching $1400 but now because of its upward slope, it is coming in beautifully at $1430, which was resistance on gold in late 2010 and late summer 2013. This is ace. I like it when a formation like this crosses horizontal resistance/support levels, gives nice potential targets in price and time.
This fork also runs parallel tot he huge fork that I have posted before, which starts in 2011 and implies that the bull market never ended. I am hoping for this to pan out.
My outrageous bullish long term forks are here for gold and silver. The gold one I am more serious about: the silver one is just for fun, about the equivalent of betting a tenner at 5000-1 last September for Leicester to win the UK football league.
Here:
http://1000gold.blogspot.co.uk/2016/05/silvers-outrageous-bull-market.html
Ag and Au.