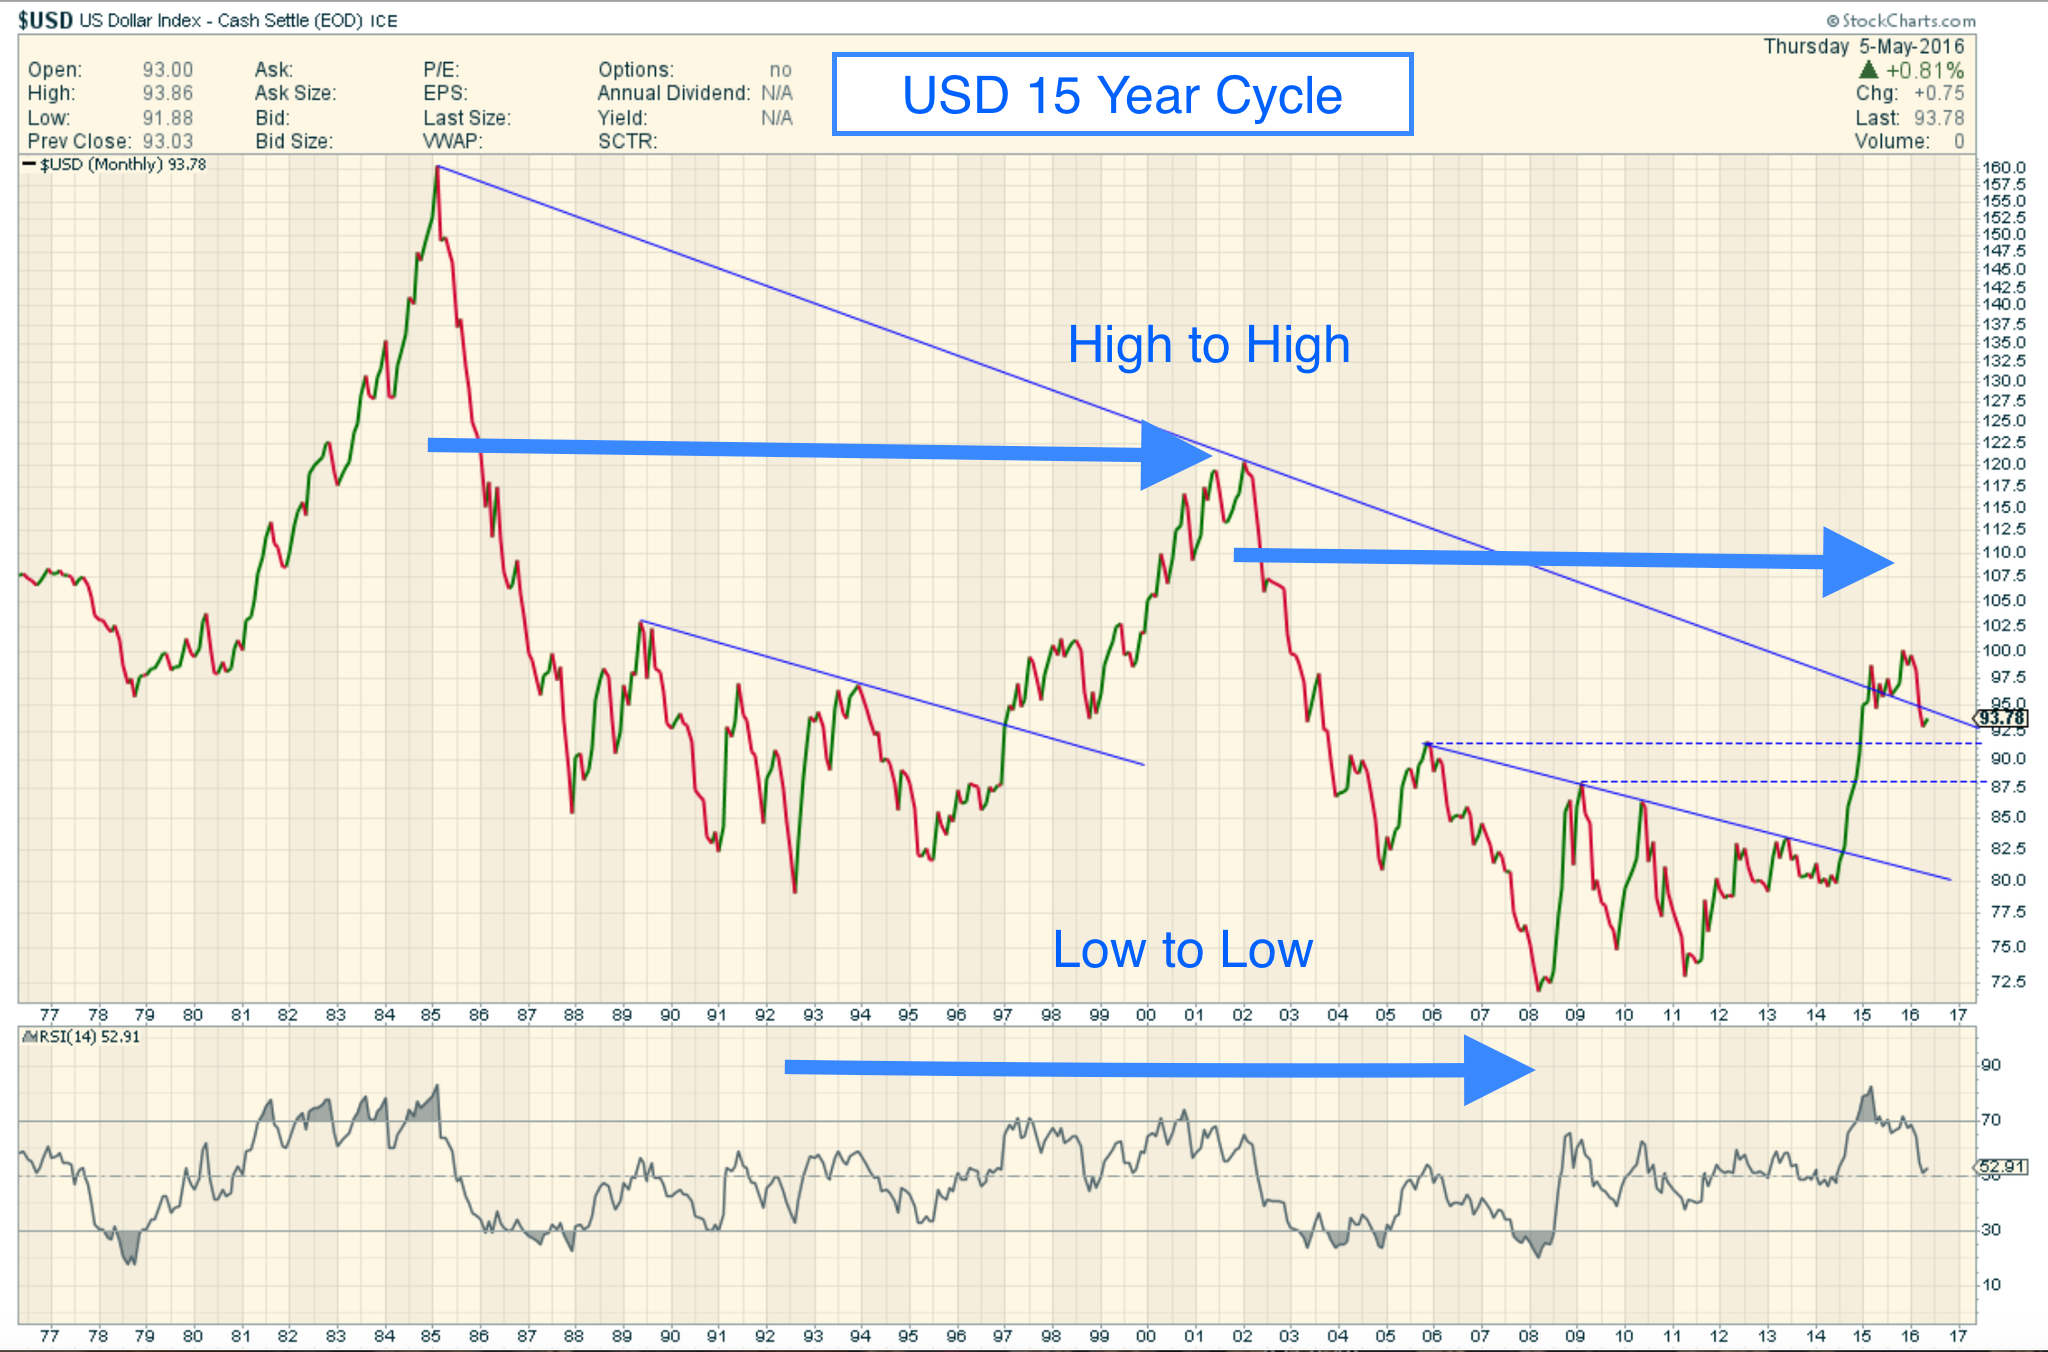
USD Long Cycle Perspective
Many Guru’s are worried about the USD bouncing here. Sure we will see bounces, but my long term Cycle analysis shows that the USD’s 3 Year Cycle has topped and very likely, the 15 Year Cycle as well. One thing you should note from Fully’s 40 Year chart is that once the 15 Year Cycle tops, the move to the downside seems to accelerate down showing symmetry to its rise.
These two charts show why Gold is moving here and why the broader CRB complex is bottoming:
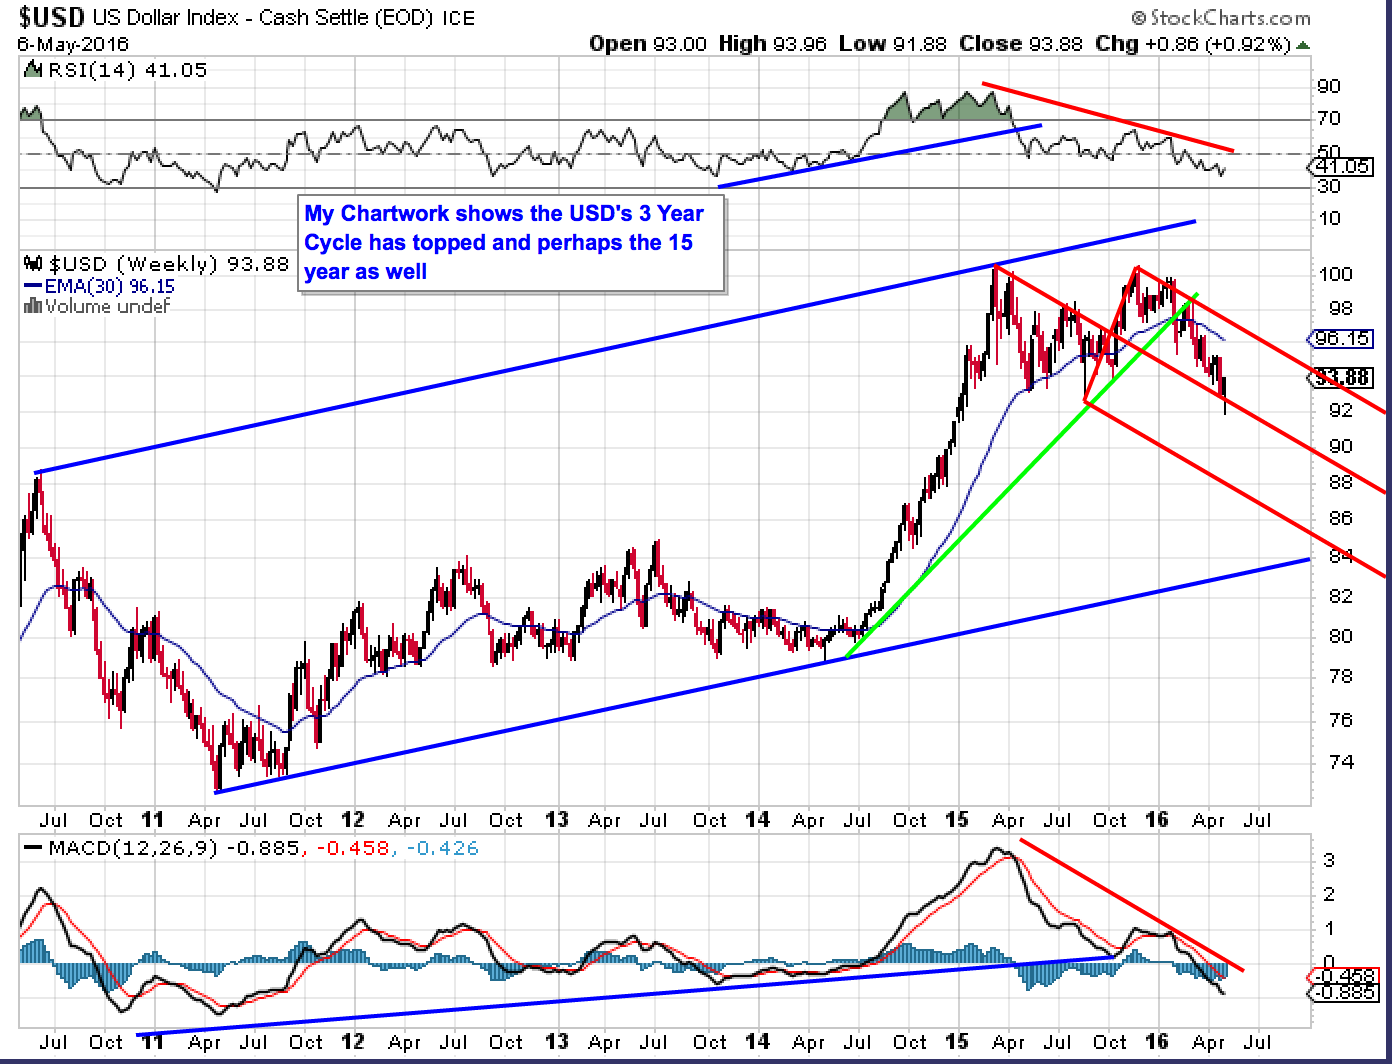
Note: First chart is Fully’s that I have annotated. The second is a “Surf City original” 😉
Need to get below $92 for confirmation….
Eagle, I agree but only somewhat as the Green line inside my larger Blue Channel is my 3 Year USD uptrend line.
Note that once the 3 year line was broken, we had a backtest and then accelerated drop to the current level. I believe it may test my upper red fork line at some point and even break it slightly, but if I am correct, the fork should channel price lower from here.
The powers that be (CB’s et al), cannot/will not let the dollar rise at risk of crashing US SM’s – last market standing (ref Rickard’s take on recent coordinated world CB agreements – evidenced by Japan’s failure to ease as dollar falls). If the dollar does rise, it is the surest sign CB’s (esp. the FED) have lost control and it’s game over – IMO, a rising dollar does not ensure falling PM’s – I’ll be watching the TLT vs GOLD spot ratio for the tell on where the safety trade is happening.
Pass the Popcorn
Just like gold’s topping process in 2011-2012. Target would be around 85.
Now someone else has a different point of view:
https://goldtadise.com/?p=369540
Non-log chart, says it can fall and still be bullish.
I am undecided on the dollar and waiting to see if the pound will crash before the Brexit vote.