Bond TLT Cycle Update
Here is an update on my last Bond post:
https://goldtadise.com/?p=368153
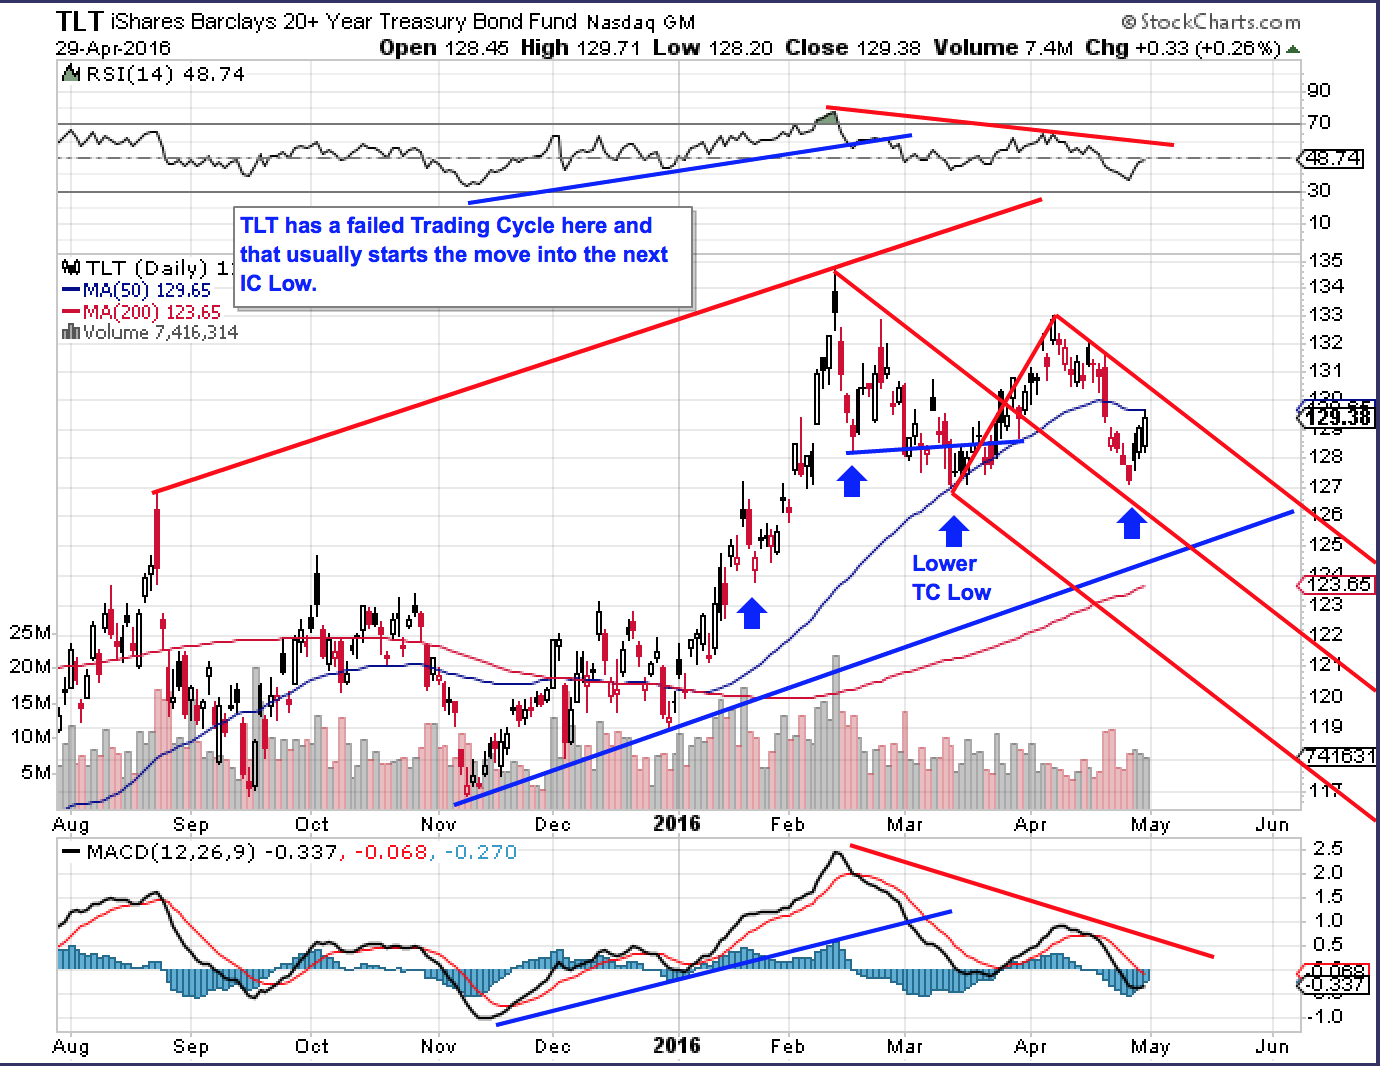
TLT now appears to be bouncing out of either a Trading Cycle low or a half-cycle low. In either case, TLT has had a failed Trading Cycle here and that usually starts the move into the next 5-6 month Intermediate Cycle low (see my first chart). During an IC Low price usually tests and breaks the blue IC uptrend line on my first chart.
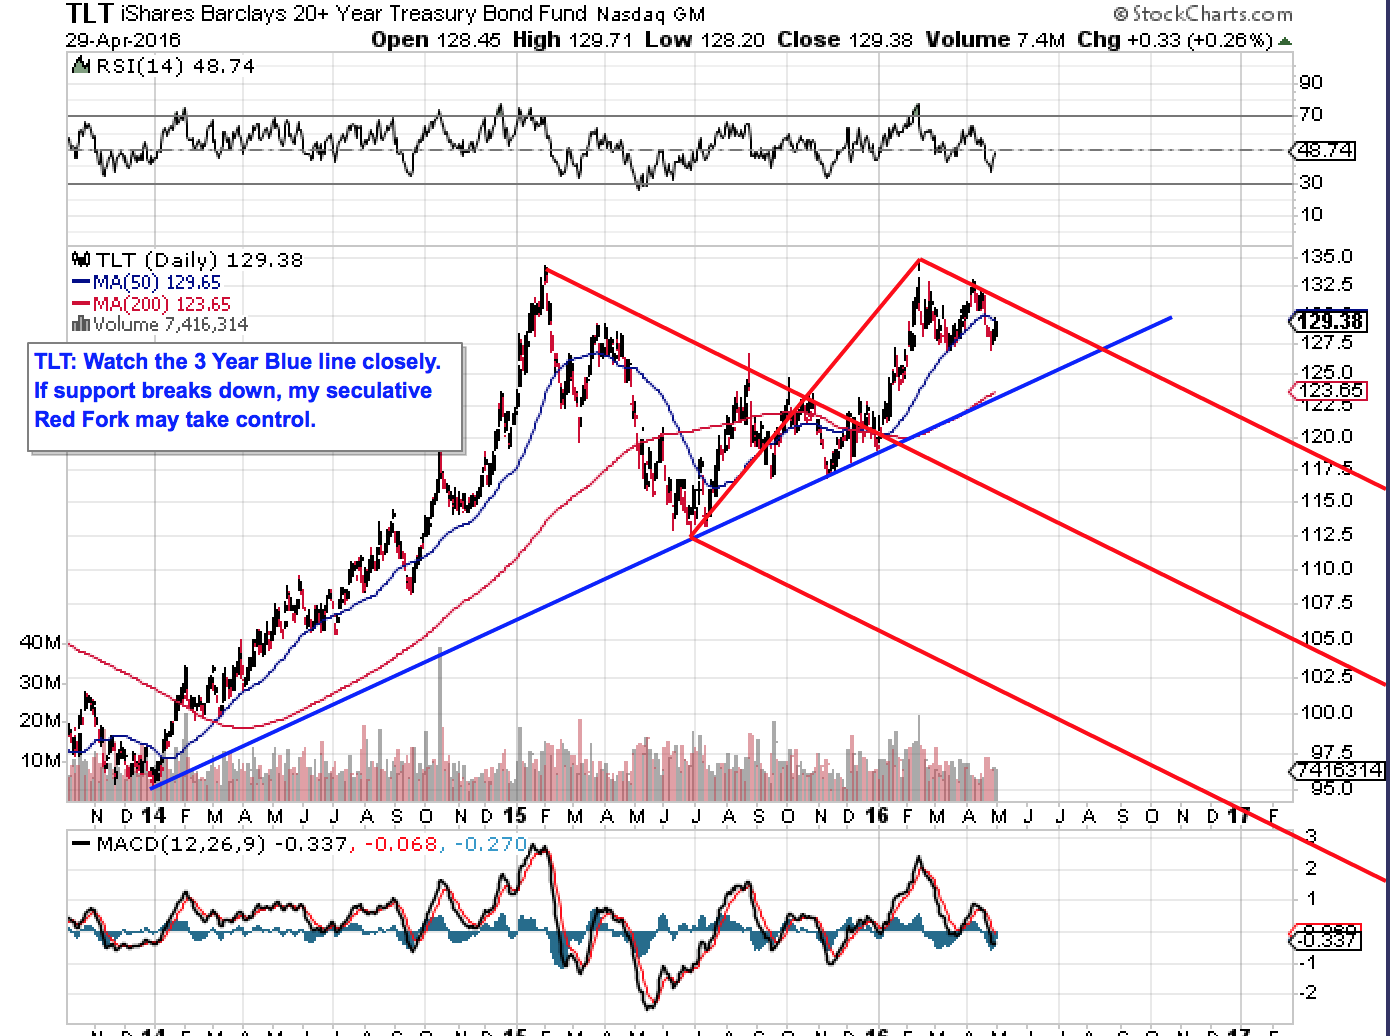
The second chart shows TLT’s 3 year Uptrend (Blue line). Note that the current IC Uptrend line on my first chart is also the same as my 3 year Uptrend line on my second, longer term chart. So any break of the current IC uptrend also breaks the 3 year Uptrend as well (similar to what has happened with the USD).
The second chart also shows a potential double top in play that looks somewhat similar to what we saw with the USD. My red fork on the second chart is somewhat speculative but if TLT breaks down below my blue 3 year uptrend then the Fork should take control.
That red fork on TLT is also similar to the speculative fork I posted on the USD in the fall of 2015 that no one wanted to believe.
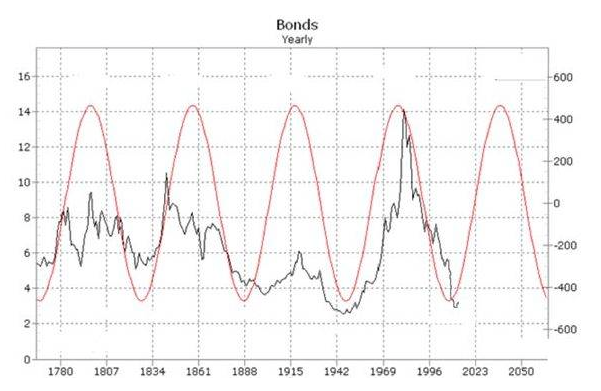
Added: Interest rates also move in 60 year cycles (30 up & 30 down) dating back to the time of Hammurabi. 😉
1985-6 to 2015-16 is 30 years, so I think rates will definitely start a long term reversal over the next year. Here are two charts:
1) Chart showing the current 30 year Bond price uptrend from 1990 that started in 1984-85.
2) 2nd chart showing the 60 year interest rate cycle going back several hundred years.
Got any TBT? 🙂