USD Cycle Update
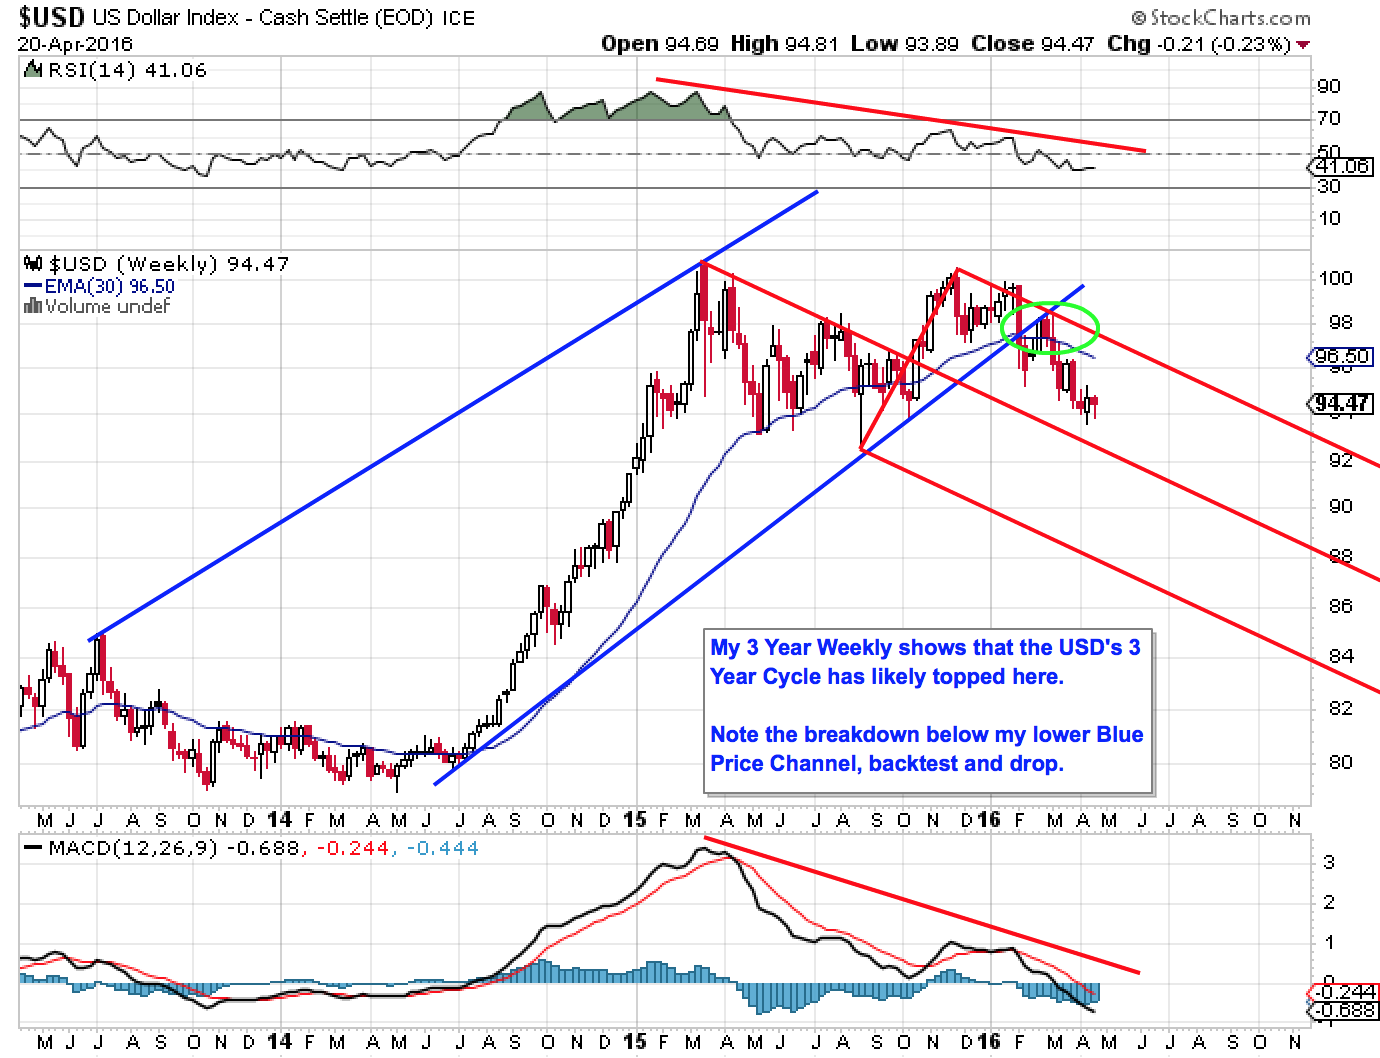
Here are a couple of USD charts. Longer term, my first chart shows that the USD’s 3 Year Cycle has topped and perhaps the 15 Year Cycle as well. The lower Blue line of my price channel is also the 3 year uptrend line. Note the breakdown of this line, backtest failure and drop. The 30ema on the weekly also appears to be rolling over.
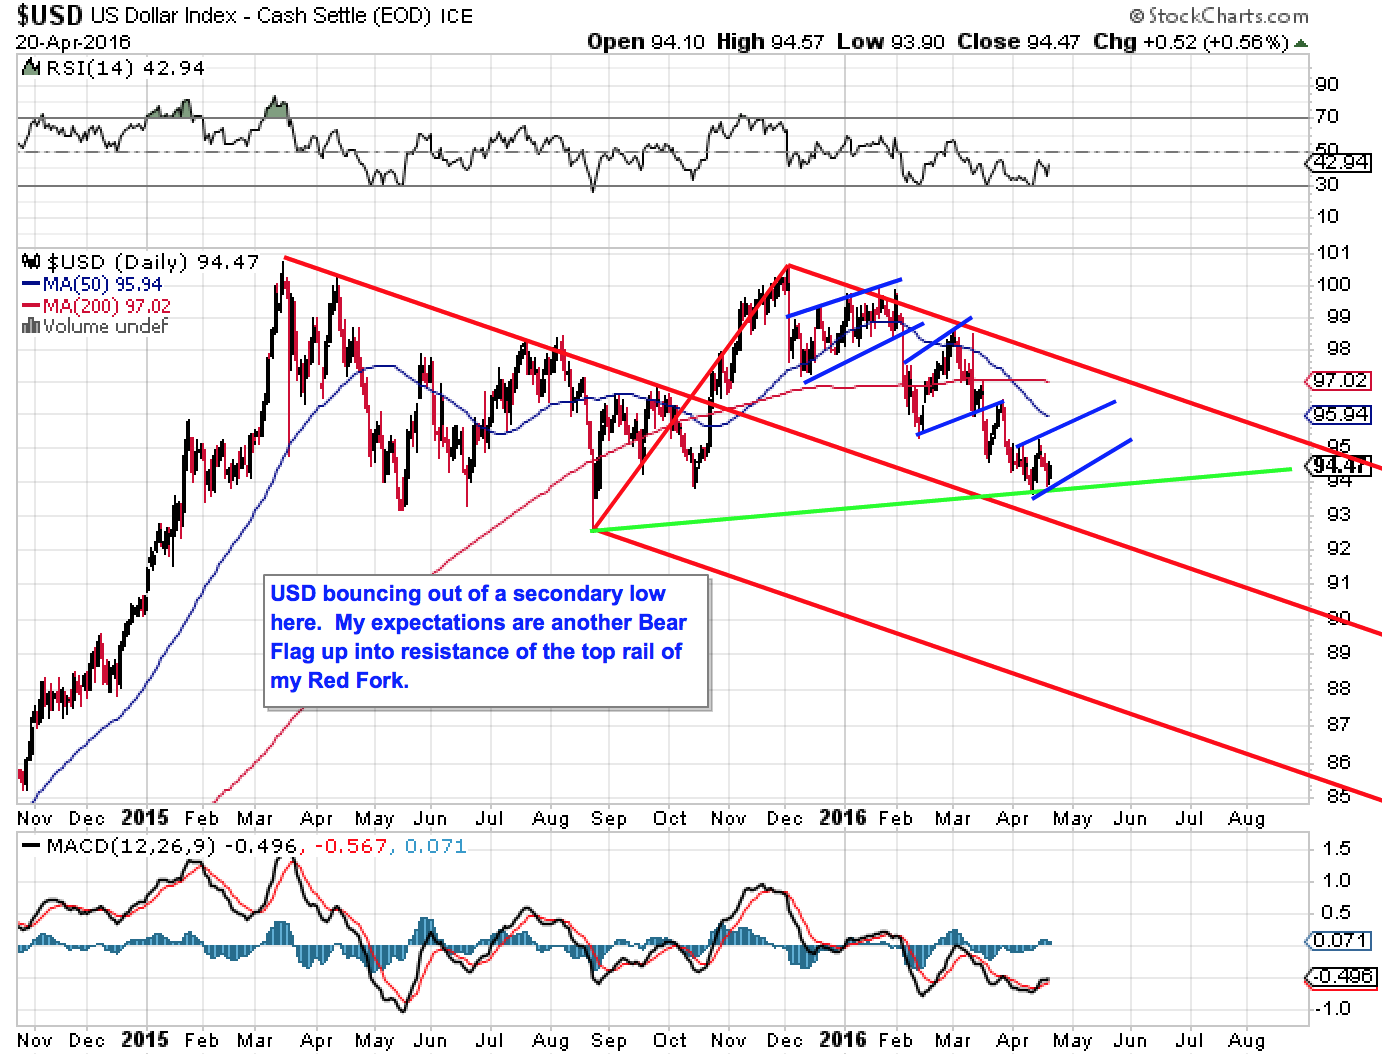
My second chart shows the near term Daily price action of Bear Flag Trading Cycles moving up to test the top rail of my Red Fork. I have the USD on Day 6 of a new Trading Cycle and what could also be a new Intermediate Cycle as well. Time will tell 🙂
Hmmm. I was thinking that USDX is consolidating for another 20 point upmove from 100 to 120.
Now as Mr. Spock says, (or was it Fully?) just LOOK at the chart… What do I see. I looked at the second of these charts and immediately though wow, this chart looks so similar to the 2011-2013 GOLD chart. Could they be in any way related?
Here is one:
http://stockcharts.com/h-sc/ui?s=%24GOLD&p=M&st=2010-07-04&en=2013-04-04&id=p02097917506&a=312811263
If it is so, then the dollar ins in the equivalent of late March or early April 2013.
I am not saying it is; it’s just a visual observation.
I have since been looking at the USDX compared to gold in 201-2013. They look quite similar to me. It was originally based on someone’s chart on the this goldtadise forum, probably one of yours or one of Gary’s; I cannot remember:
https://goldtadise.com/?p=368342
Actually, the original chart was here by Surf City. The one on the right hand side. For a moment I though it was actually the gold chart from 2011-2013! :-
https://goldtadise.com/?p=367650