Gold pennant? It would allow $1210-1230 range for Monday if it holds.
I saw a pennant in gold yesterday. Here it is:
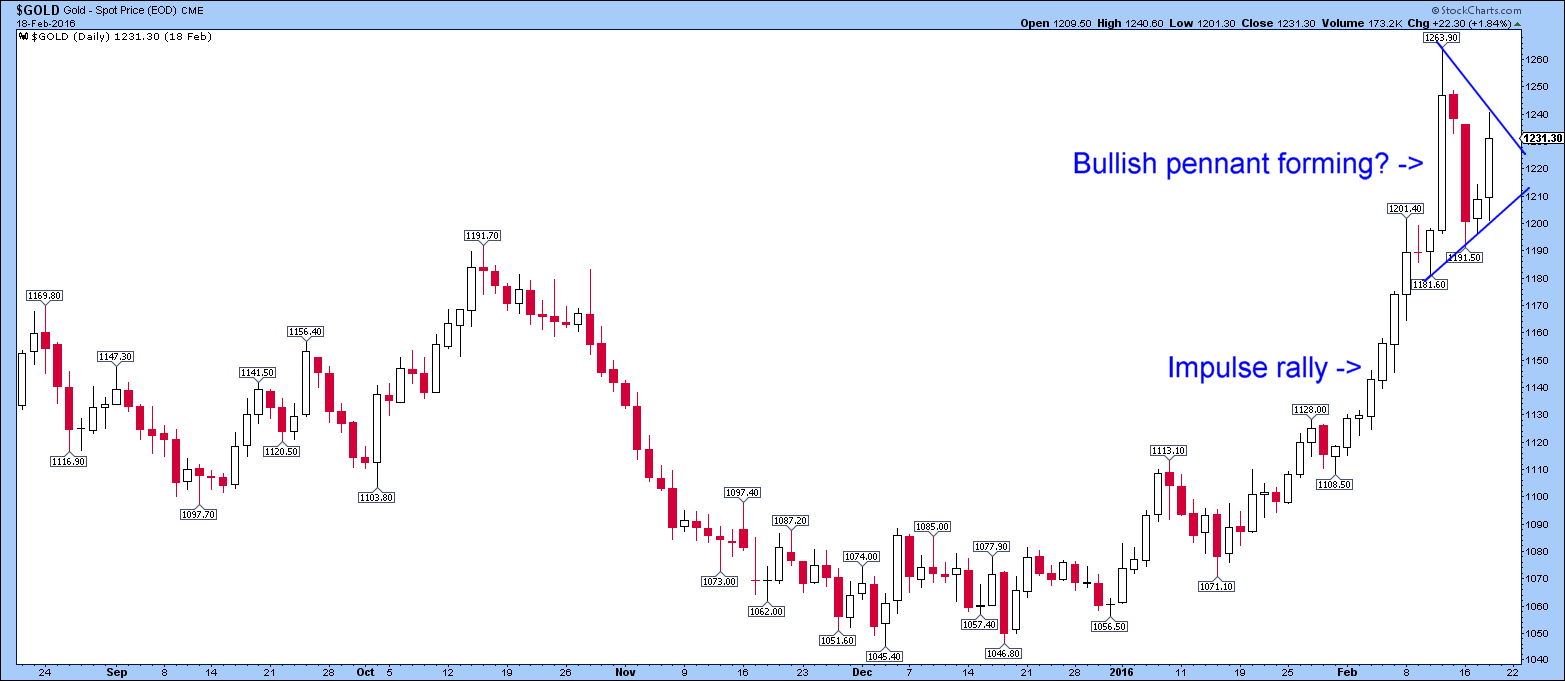
Compare with Graddy’s one linked below- similar but slightly different. It depends on visuals. I liked that low in the $1180s and the higher low in the $1190s as the basis instead, so I included a little action from before the $1263 high.
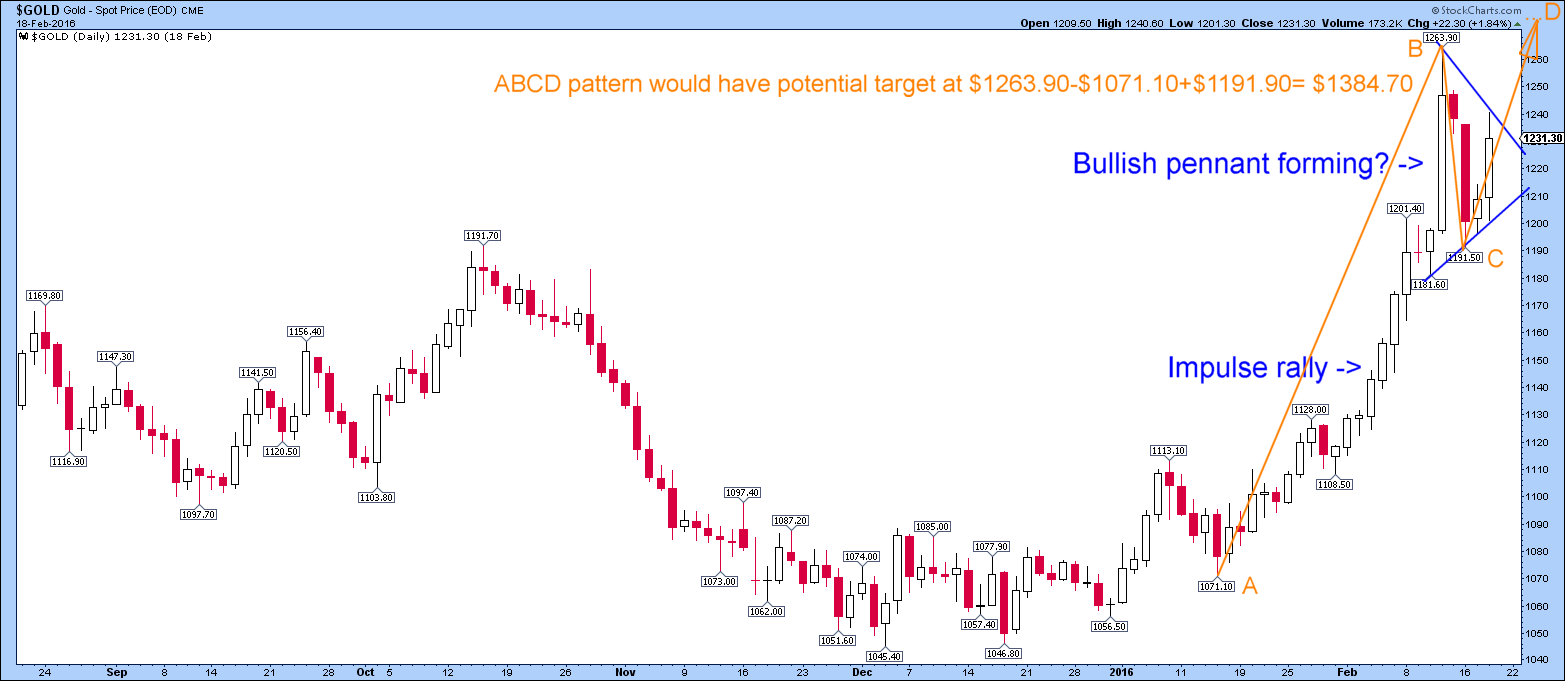
OK for a bullish target: $1384.70. It depends on where you start the impulse leg though but it depends more on whether the bears can ruin the pennant and make it collapse down again!
The way I have drawn it, means it would have to resolve within 3 more trading days maximum i.e. by about Wednesday 24 February 2016:
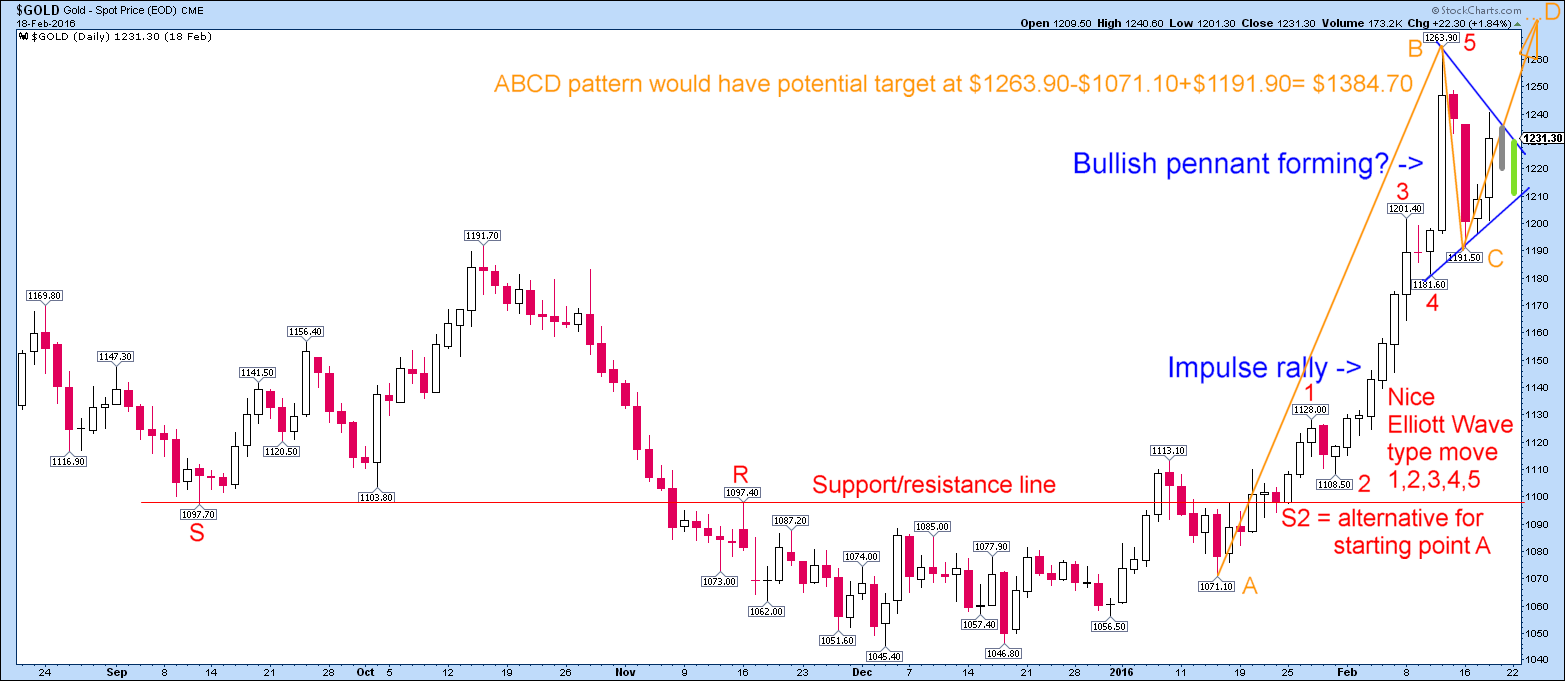
I am going to paint today’s trading range (Fri 19 Feb) on the chart $1219-1235 so far (grey bar). It fits well: in fact $1206-1235 would have been permissible and $1210-1230 for Monday perhaps (green bar):

See comments section for alternative starting price for upmove:
Such a GORGEOUS pattern! Maybe it will have to be ruined by the close tonight!
Compare Graddy’s flag:
http://goldtadise.com/wp-content/uploads/2016/02/GOLD-bull-flag-at-1200.png
from:
I like those charts, Dave. It sure looks like bullish pennants to me. 🙂
I think we will go with your pattern Dave, looks more stylish and fits better than mine.
What would be your PO on that baby..? Where would you set the start of the pole as it is a parabolic run up to it..?
Sorry, saw now that you have 1384. Fits quite well with my 1350 expectation:
http://goldtadise.com/?p=362443
Hmmm if I take 1097.40 as per my last chart I would get 1358.40.
Wishing!!
Thanks Graddy! I am not sure. I am taking a Rick Ackerman ABCD style trident trading thing and saying $1384 but that is a bit extravagant I know. I am taking 1071.10 as the start of the impulse leg though Ackerman might take one of the earlier pullbacks. He often takes the first pullback after the low of the previous move.
Pole? I thought you were referring to some mega technical term – I guess you mean the flagpole of course! Yeah well, 1071 will do for starters, point A on my chart.
http://stockcharts.com/school/doku.php?id=chart_school:chart_analysis:chart_patterns:flag_pennant_continuation
They tell me to take it from a break of resistance instead, so maybe $1128, $1113 (but they are just pullbacks on the way up). I would perhaps say $1097.40 since that is the highest of several small highs in the bottoming pattern and also I note a low to the left of the chart of where $1097.70 was support.