GDX Monthly
I make a habit of trading what’s right in front of me on the charts and I keep bullish and bearish scenarios in view. I realize the month isn’t over yet but we are setting up pretty good odds of inking back-to-back reversal candles on the monthly chart on very heavy volume. This occurs while we have OBV divergence showing up for the first time in this 4-year downtrend. And the metal broke a downtrend line today too on heavy volume. To me this is just another line of evidence that this long trade may have some legs, possibly back to channel resistance…but I suspect $16+ may be all we get and it may peak in October. Make no mistake we are still in a downtrend and I will continue to monitor structure.
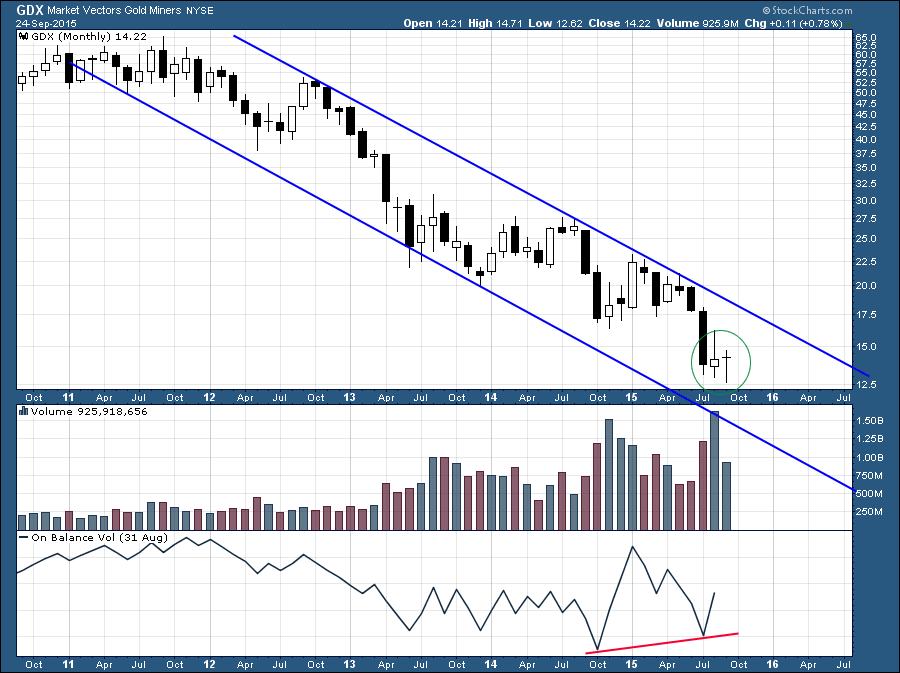
Good catch on that monthly divergence, It also shows up nicely on the daily chart.