Rambus Chartology
A Sample of Tonites Report :
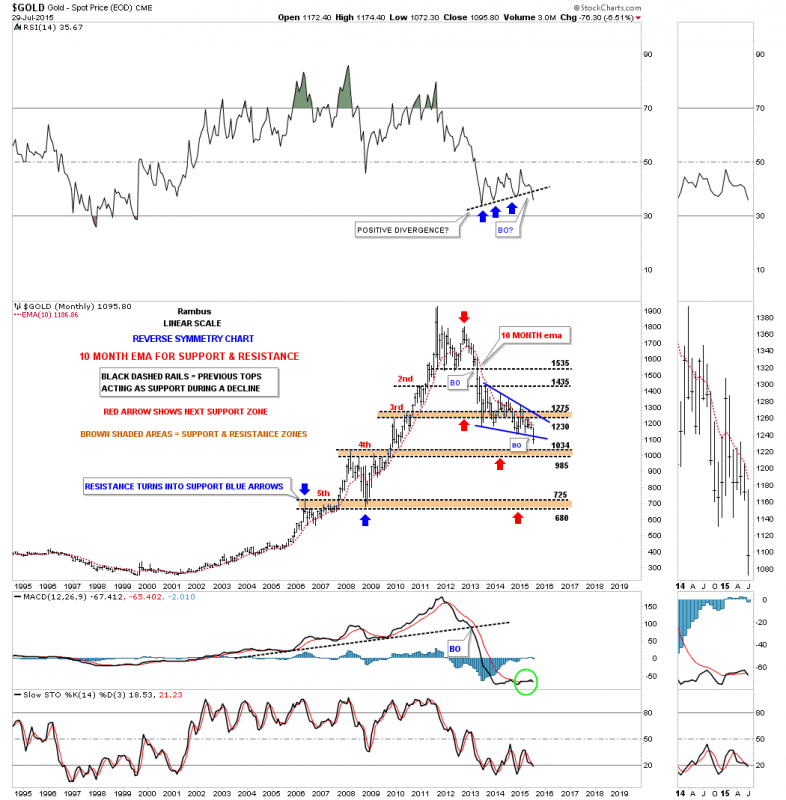
The monthly chart for gold shows why the 1000 area would be a good first place to see a small bounce to backtest the bottom rail of the blue falling wedge. How gold moves down is hard to predict as it could backtest now and then fall to the 1000 support zone or it could just keep falling and get their. No matter how it reaches the 1000 area there should be a decent rally that backtests the bottom blue rail of the falling wedge. One last thing on the monthly chart below. Notice the RSI indicator at the top of the chart that just broke below the S&R line that many were viewing as a bullish setup for gold. This is one of the characteristics of a bearish falling wedge and just the opposite of a bullish rising wedge where you have a series of lower lows on the RSI. The bottom line is, the falling wedge has broken to the downside which is bearish.
This is new to me …The Positive Divergence FAILED …and this is a characteristic of the BULLISH Falling Wedge
Which shows up in fast moving markets .
I thought I should share this tidbit here at Goldtent TA Paradise .
Learn something every day !
Fully
“Technical analysis is a windsock, not a crystal ball”