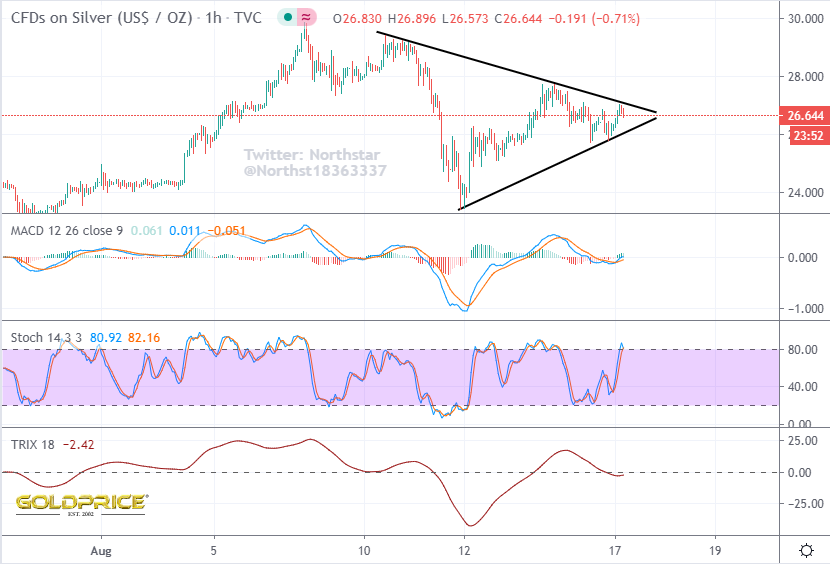
Decision Time Again
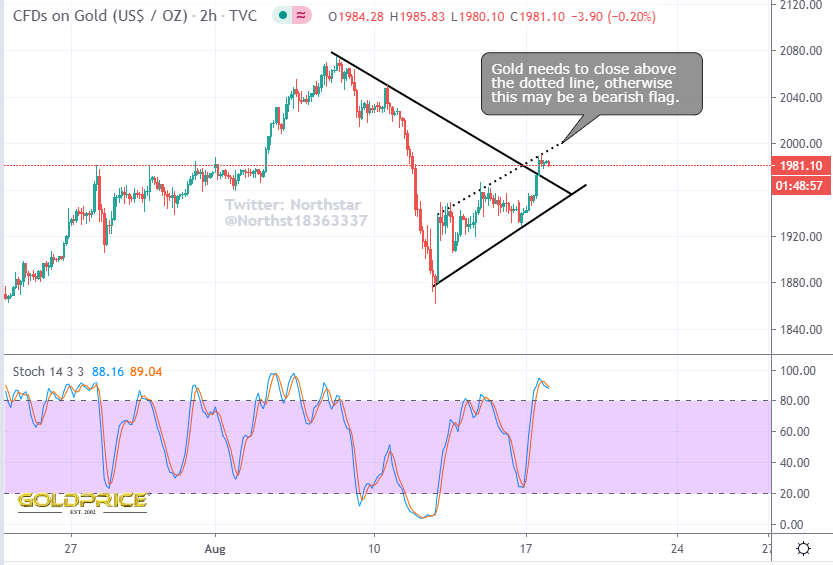
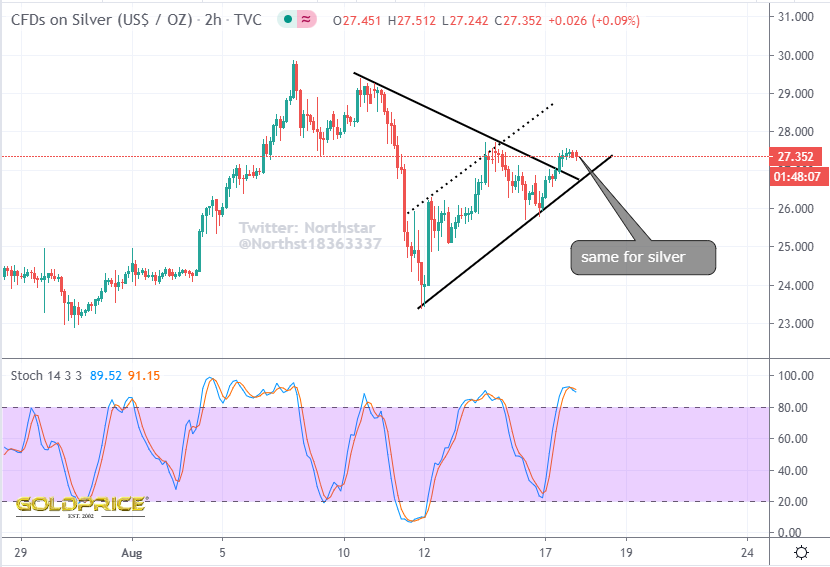
Are the bearish flags/pennants valid ? Will gold/silver break higher, or plunge into a deeper, more protracted pullback ?
Are the bearish flags/pennants valid ? Will gold/silver break higher, or plunge into a deeper, more protracted pullback ?
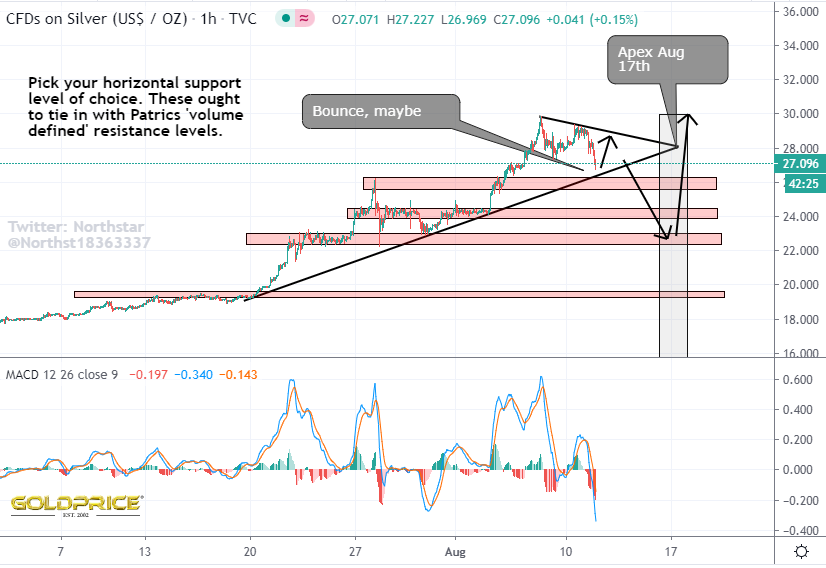
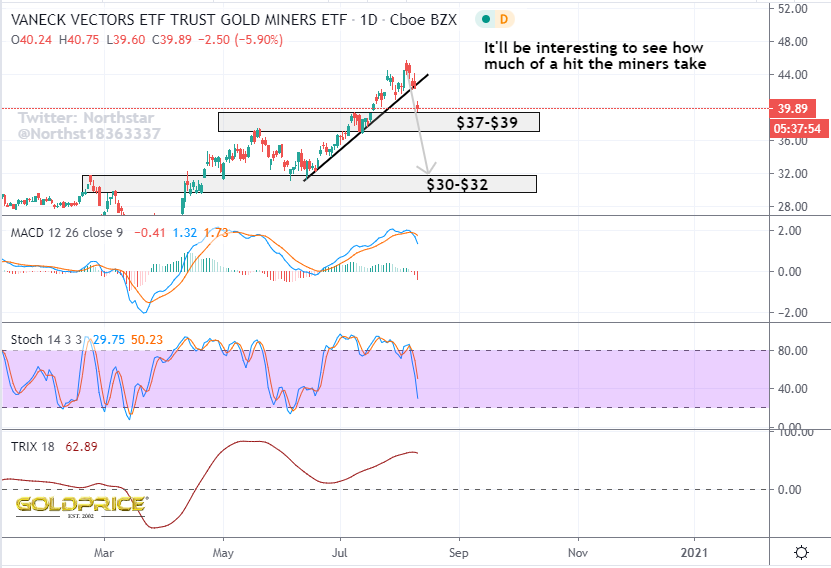
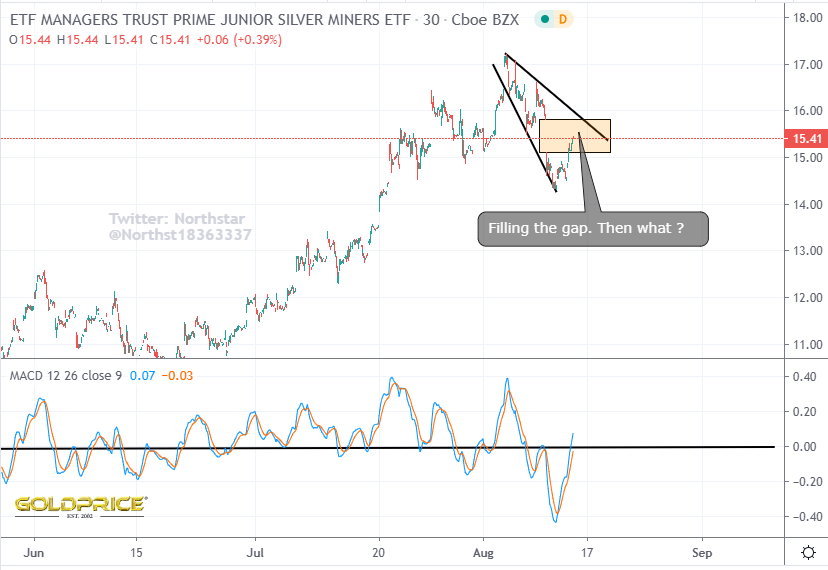
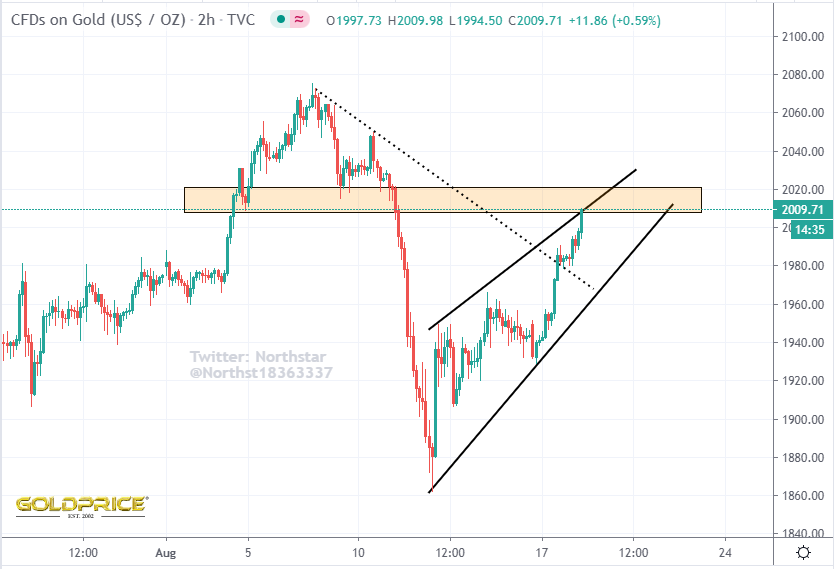
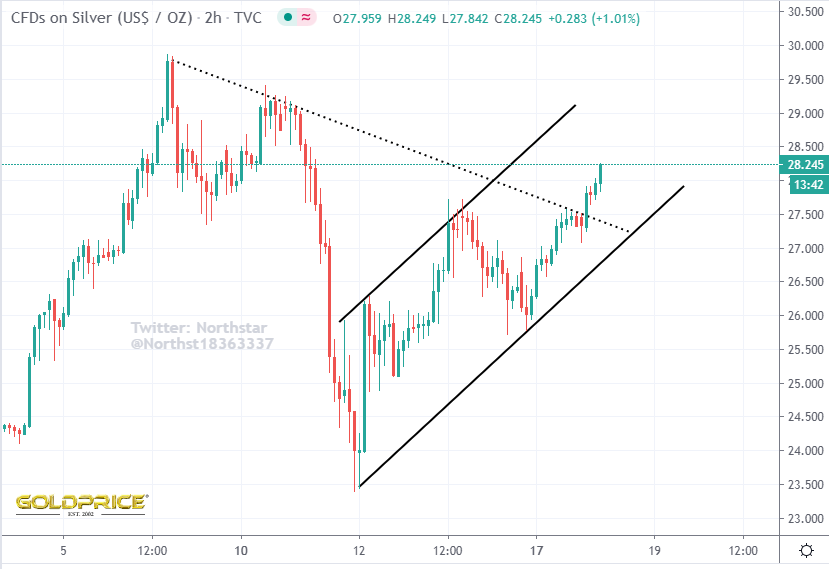
Although the miners look bullish, there is another reading of the gold/silver charts. Do we have bear flags in the making. It would project silver down to $21 and gold to somewhere just below $1800
Noticed the flag breakout earlier today. Price then shot up 26% and bounced off the resistance line. I’m pretty sure we’ll burst through soon.
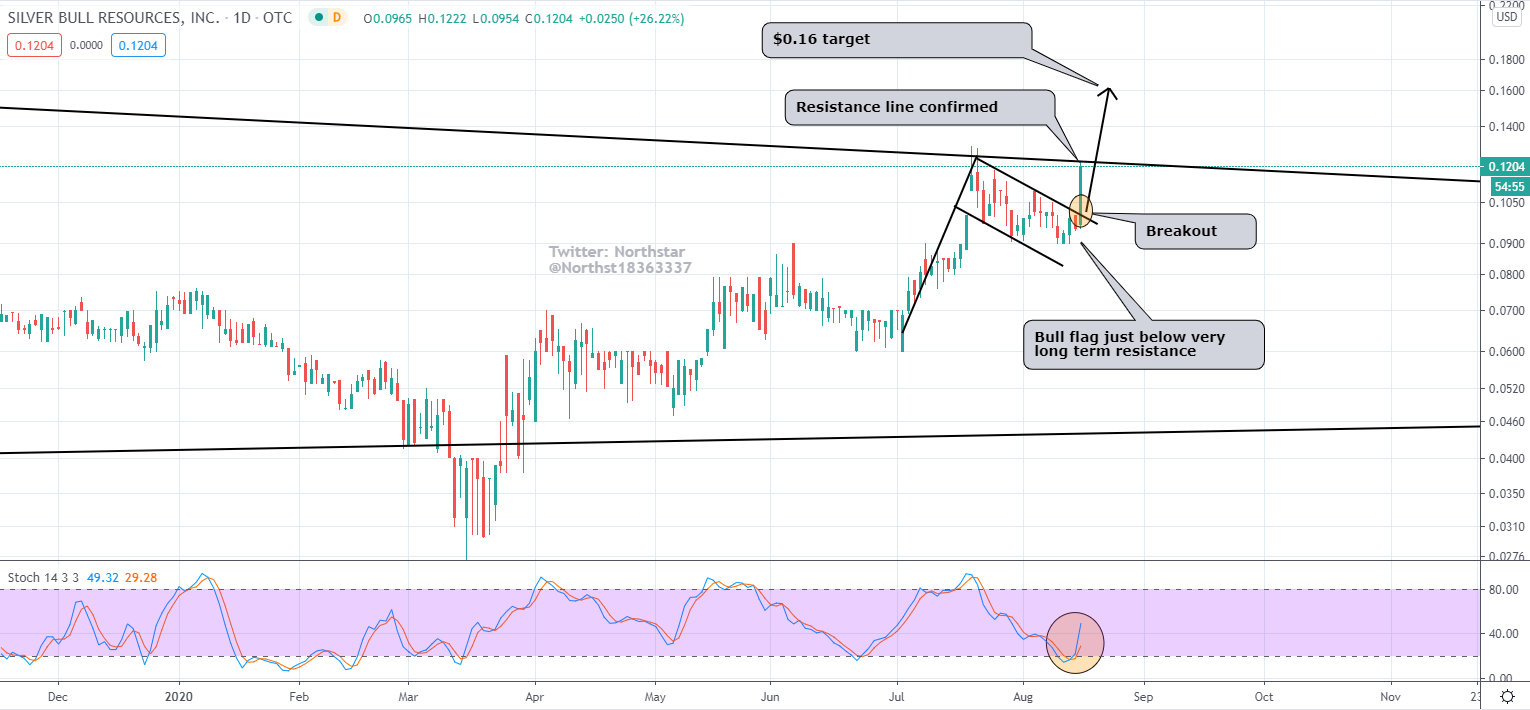
Chart update
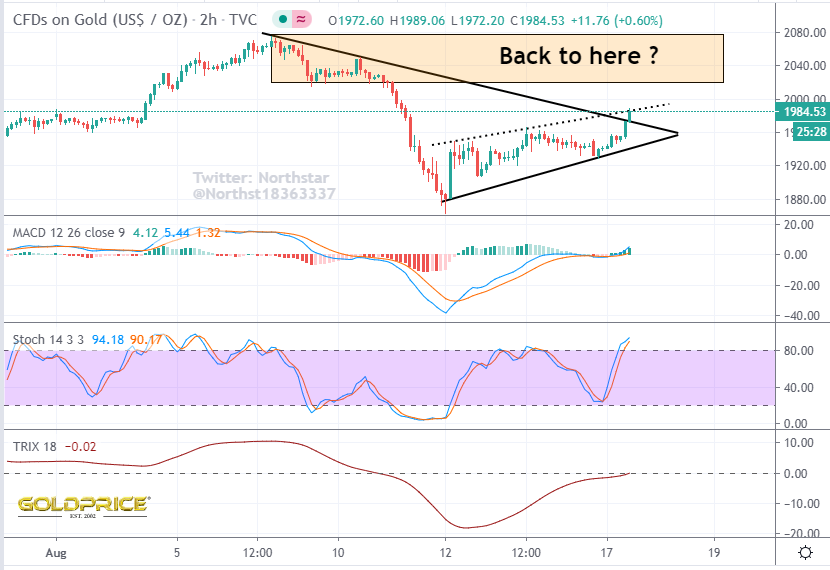
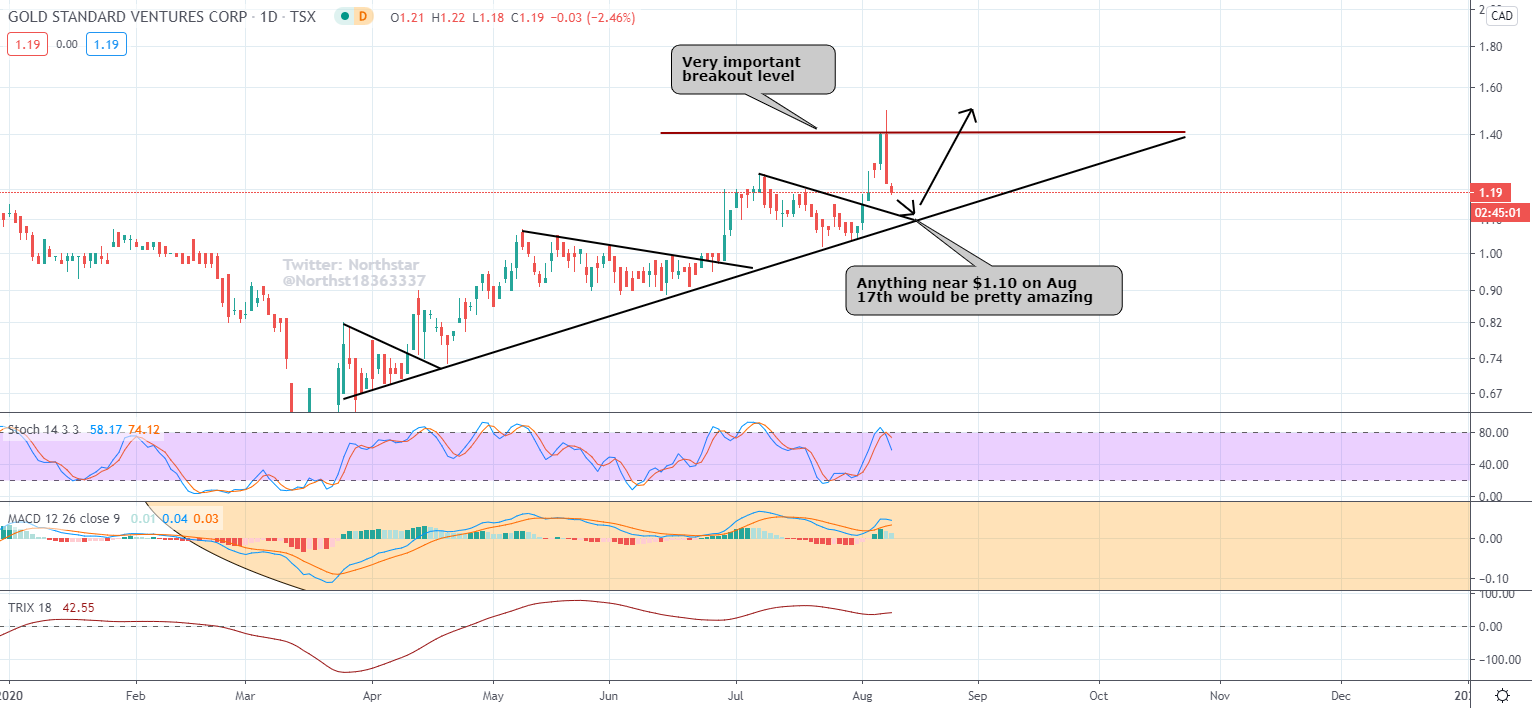
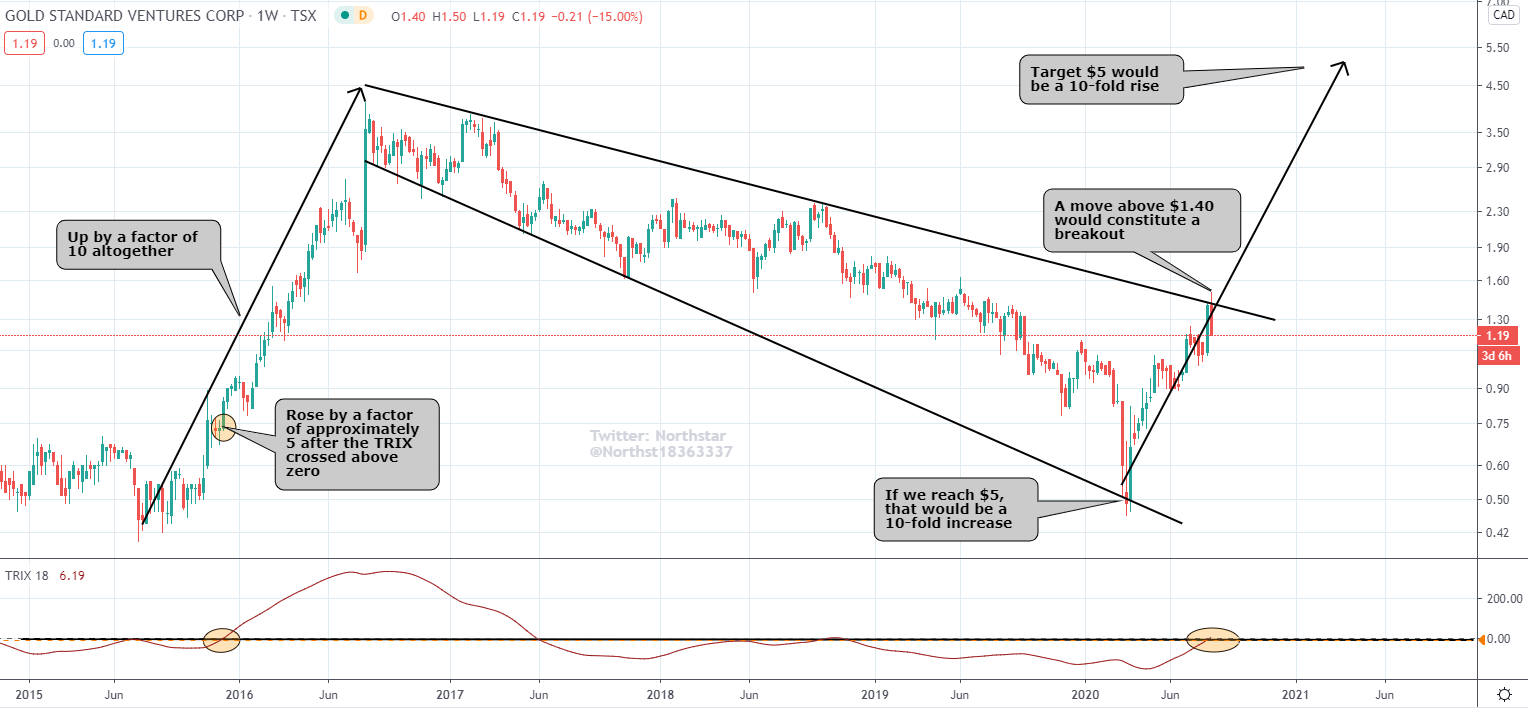
A move through that dotted resistance line and we’ll be there
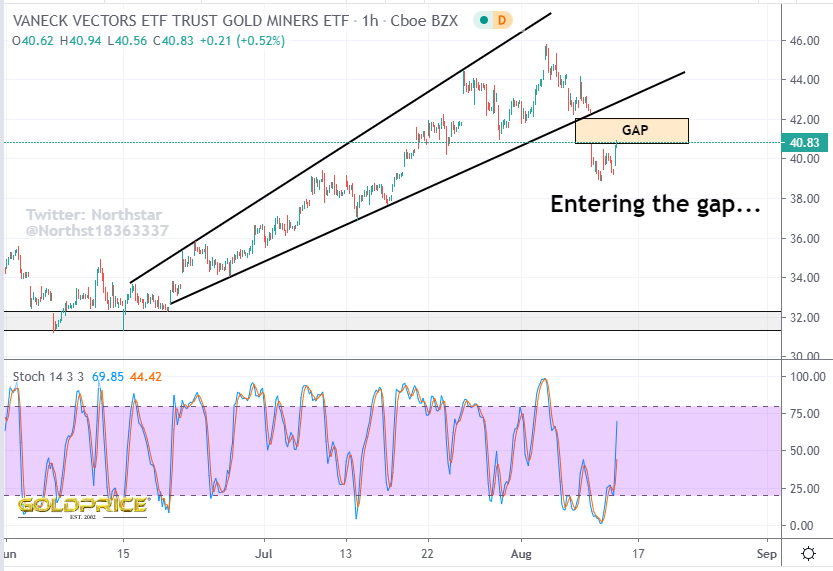
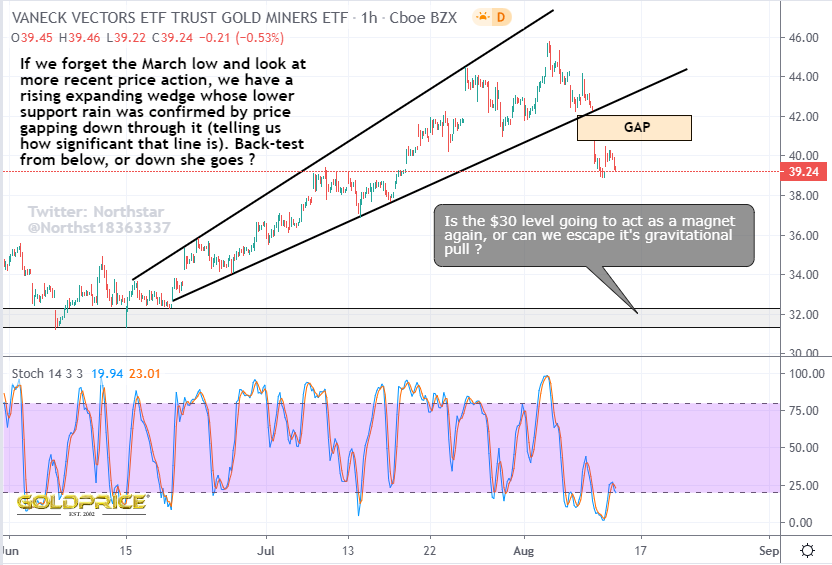
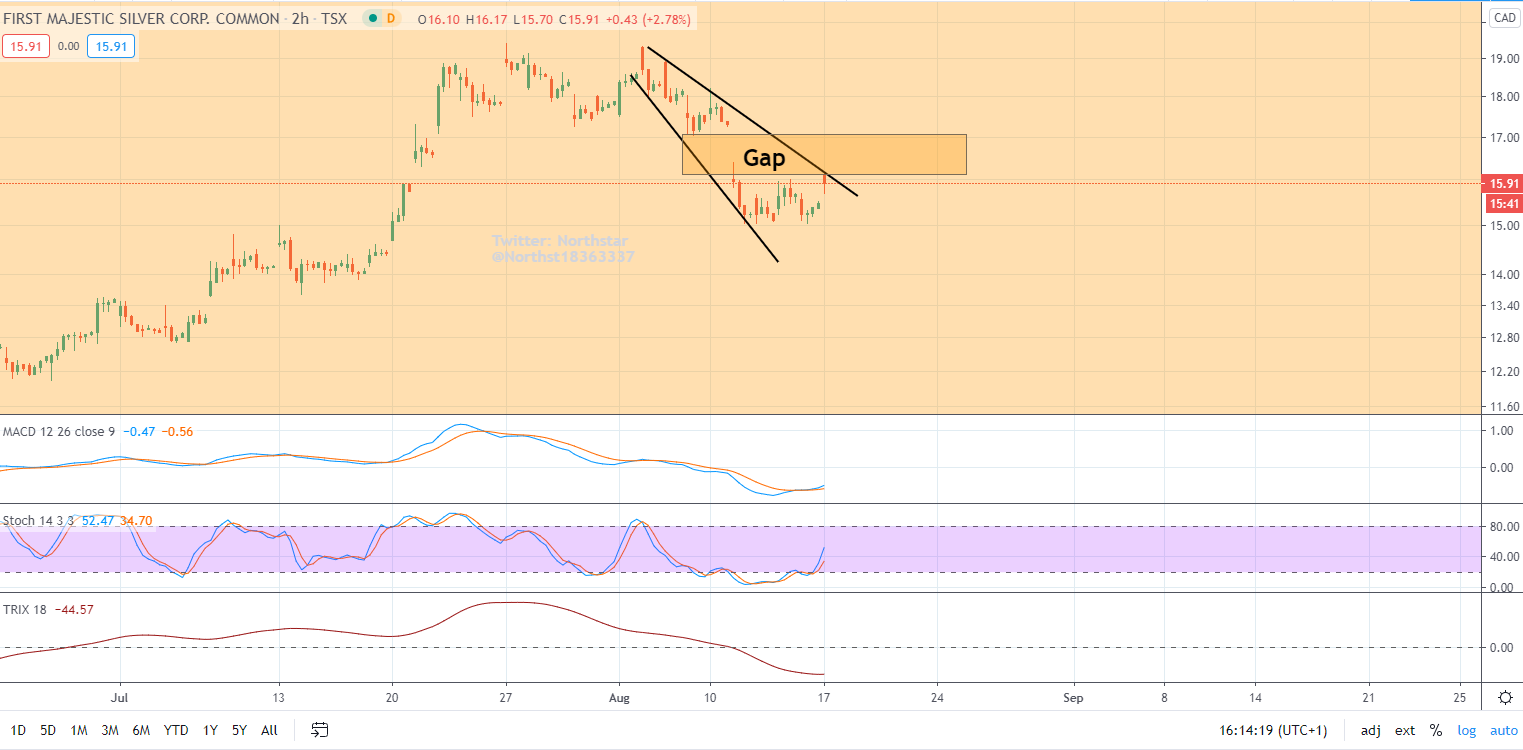
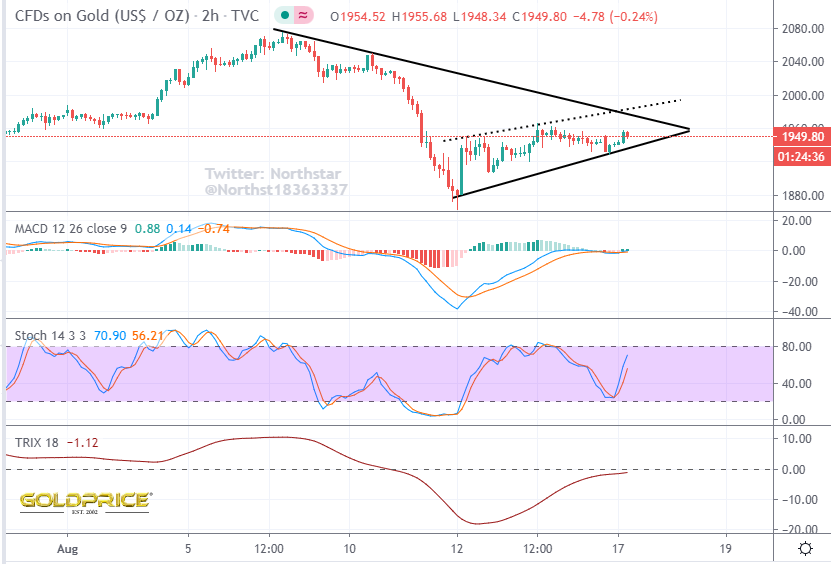
Everywhere I look I see bull flags or bullish expanding falling wedges. Here’s another, with the added bonus of a gap directly above, giving a likely swift 6% move up
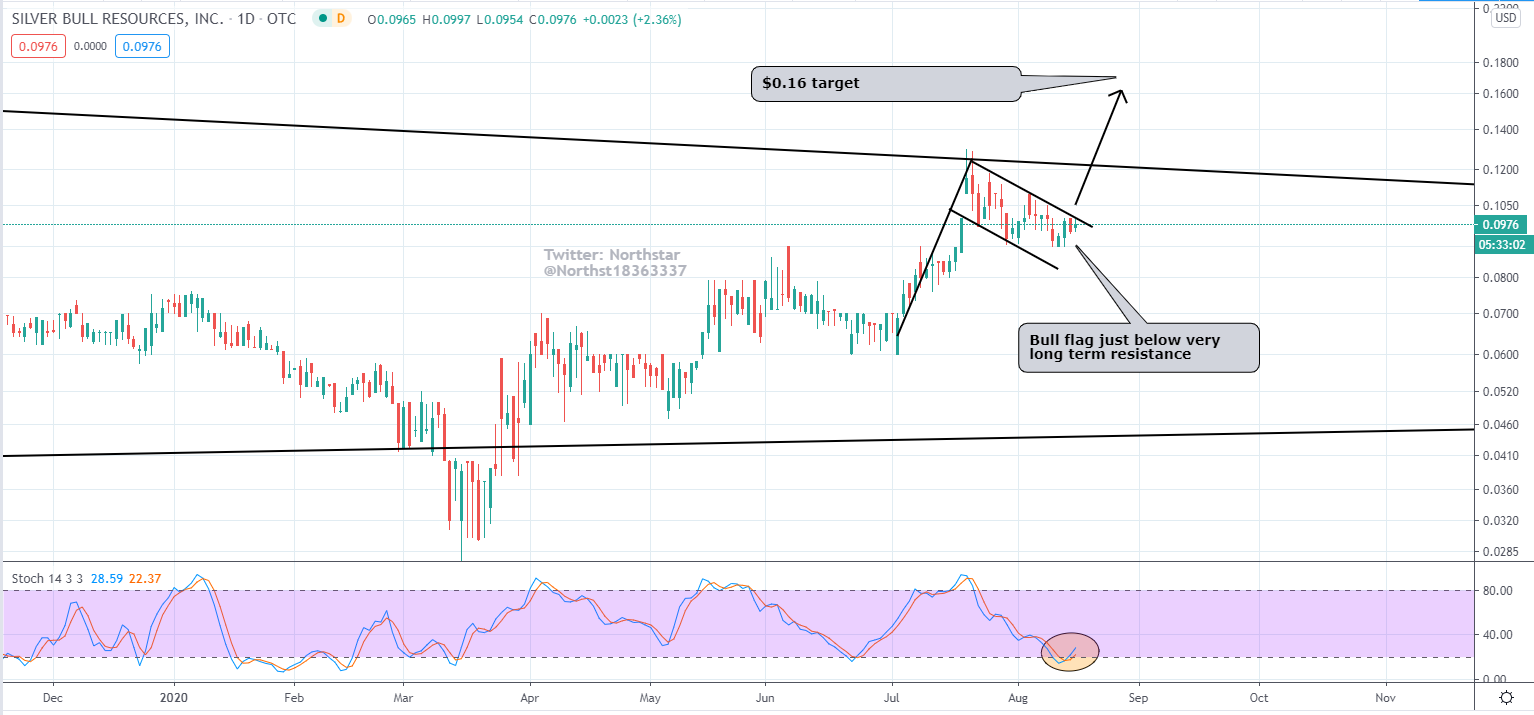
Looking ready to go…
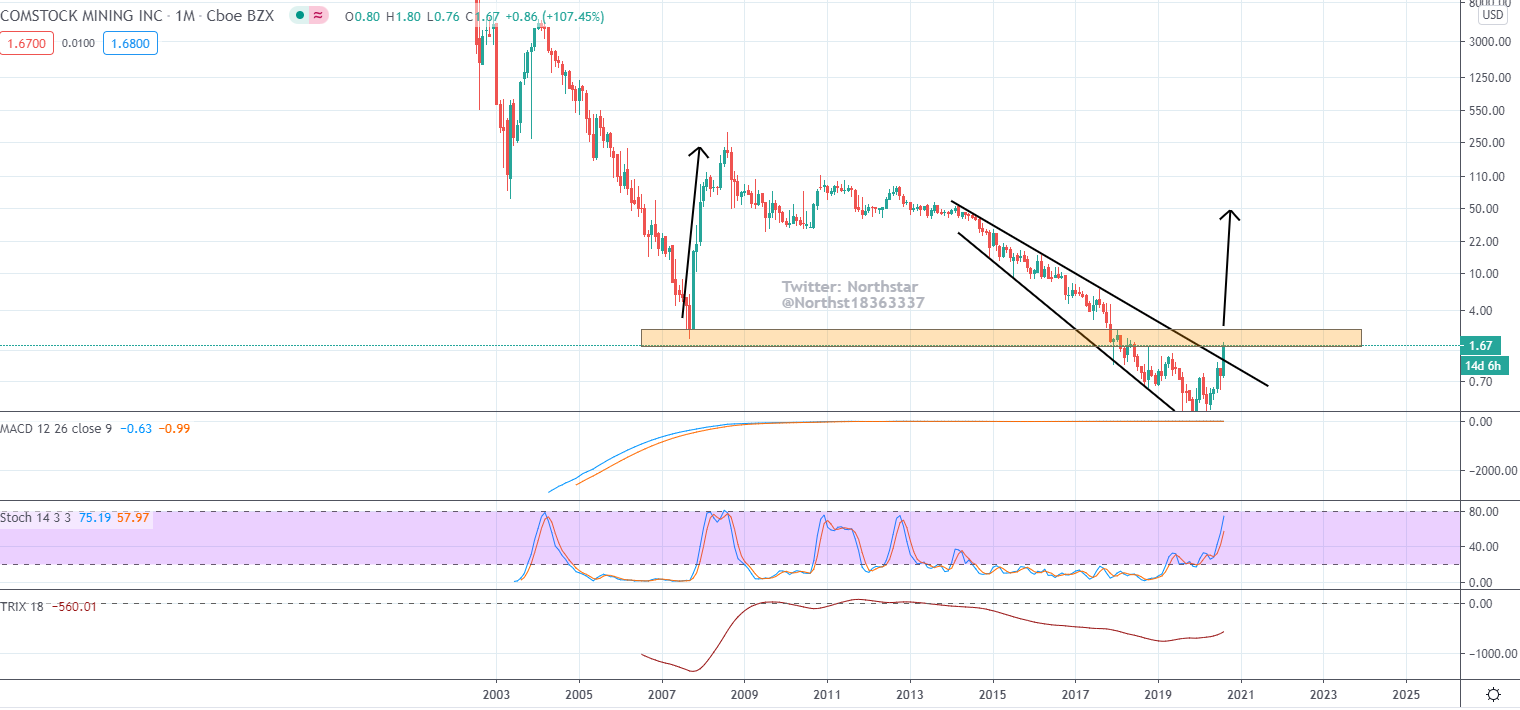
Comstock just punched through long term resistance on good new release
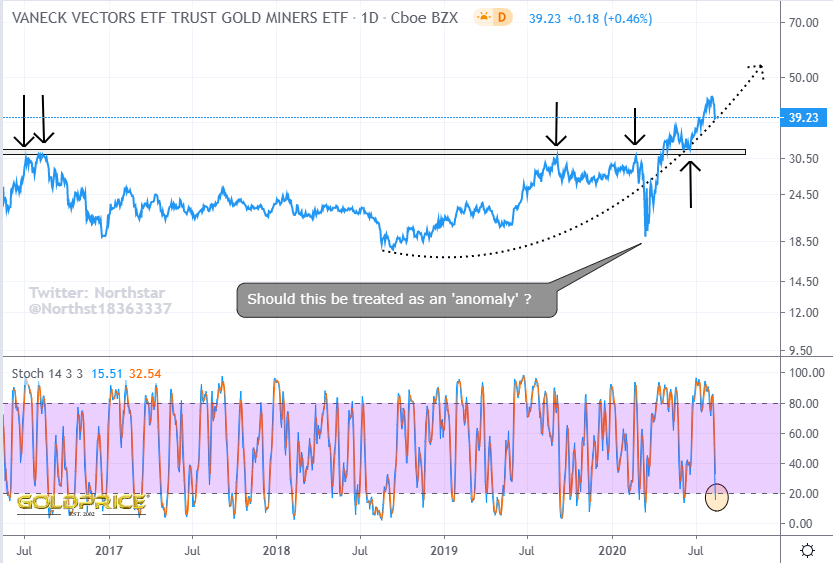
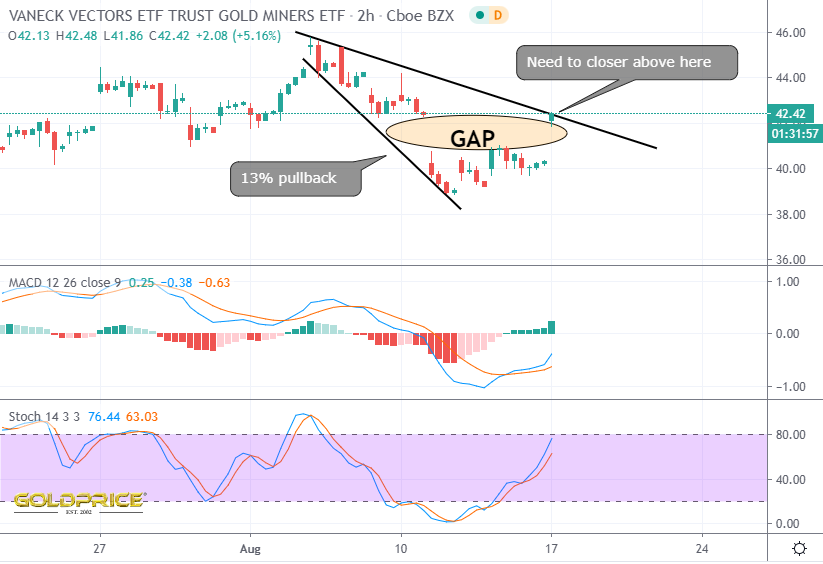
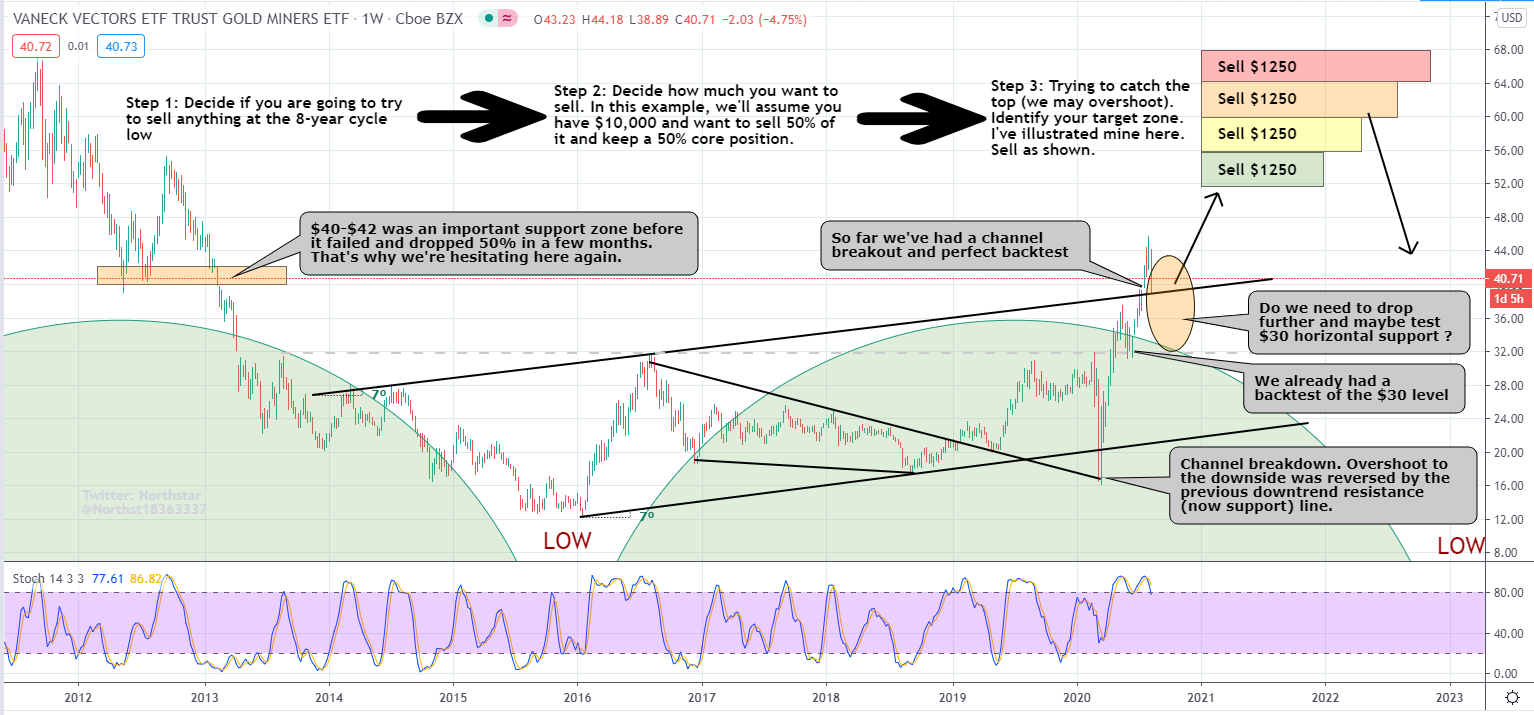
The GDX Express will be leaving the station IF we close above the current level.
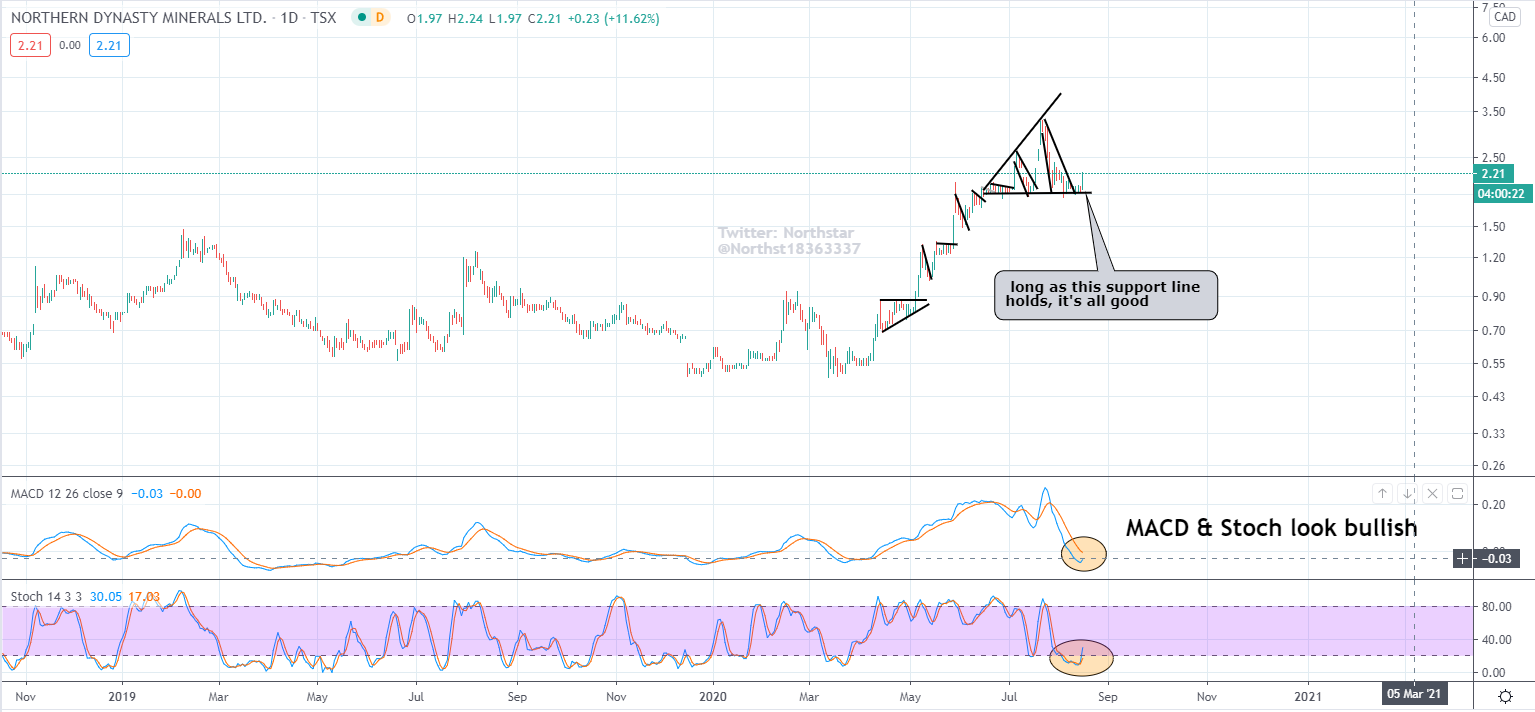
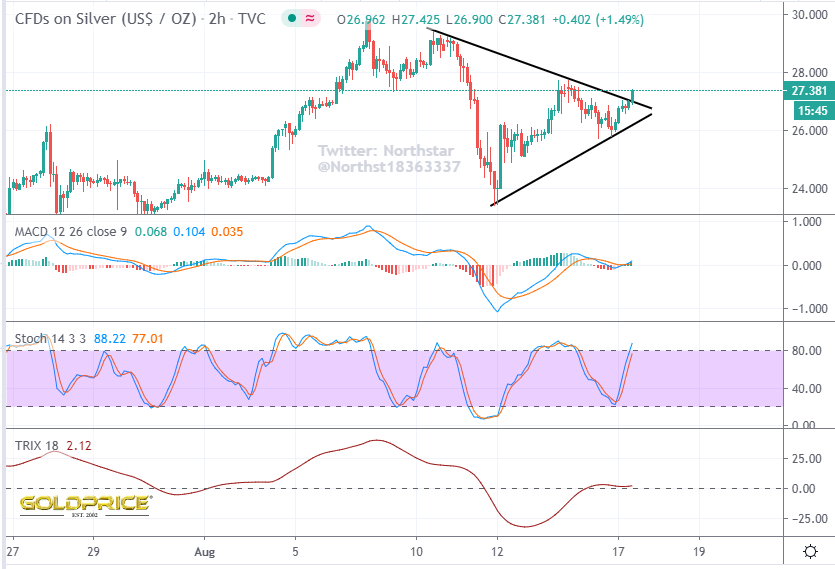
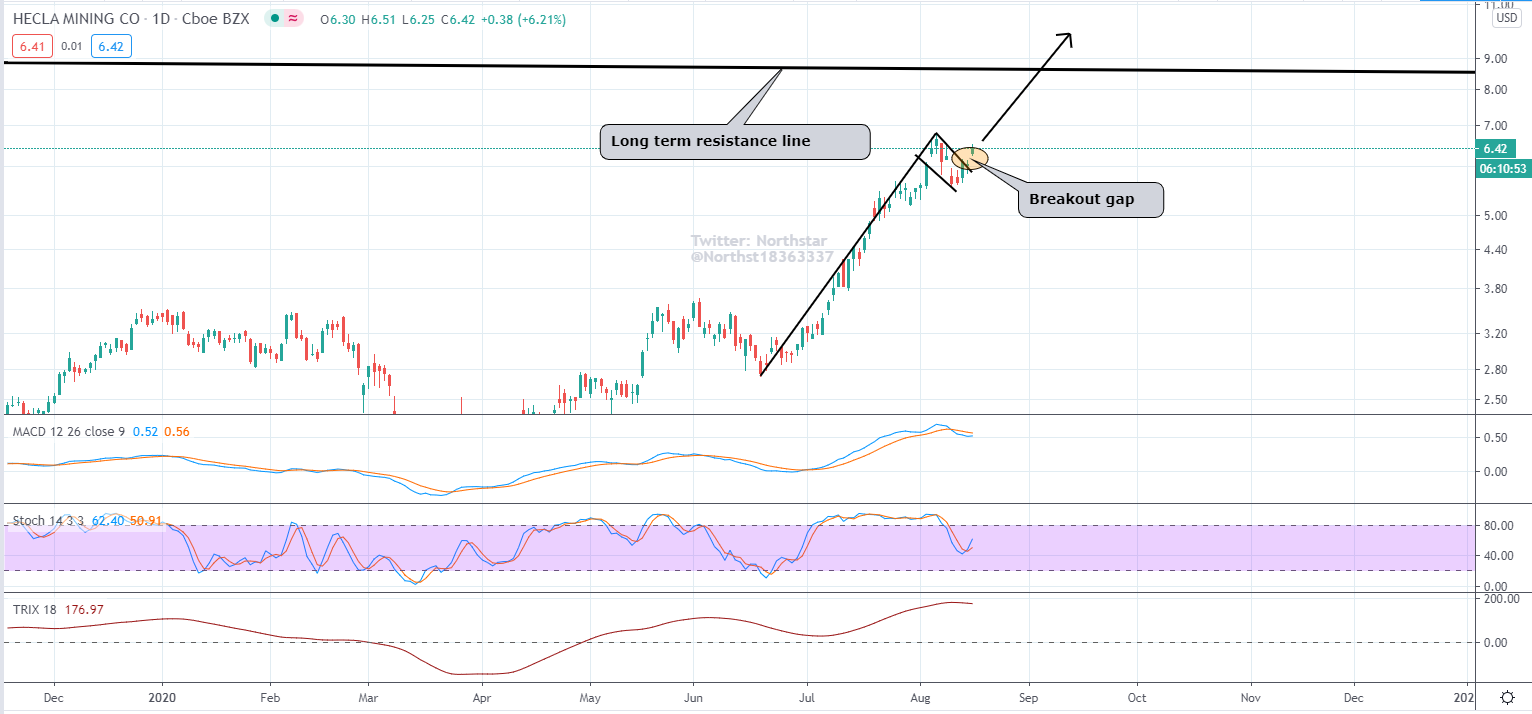
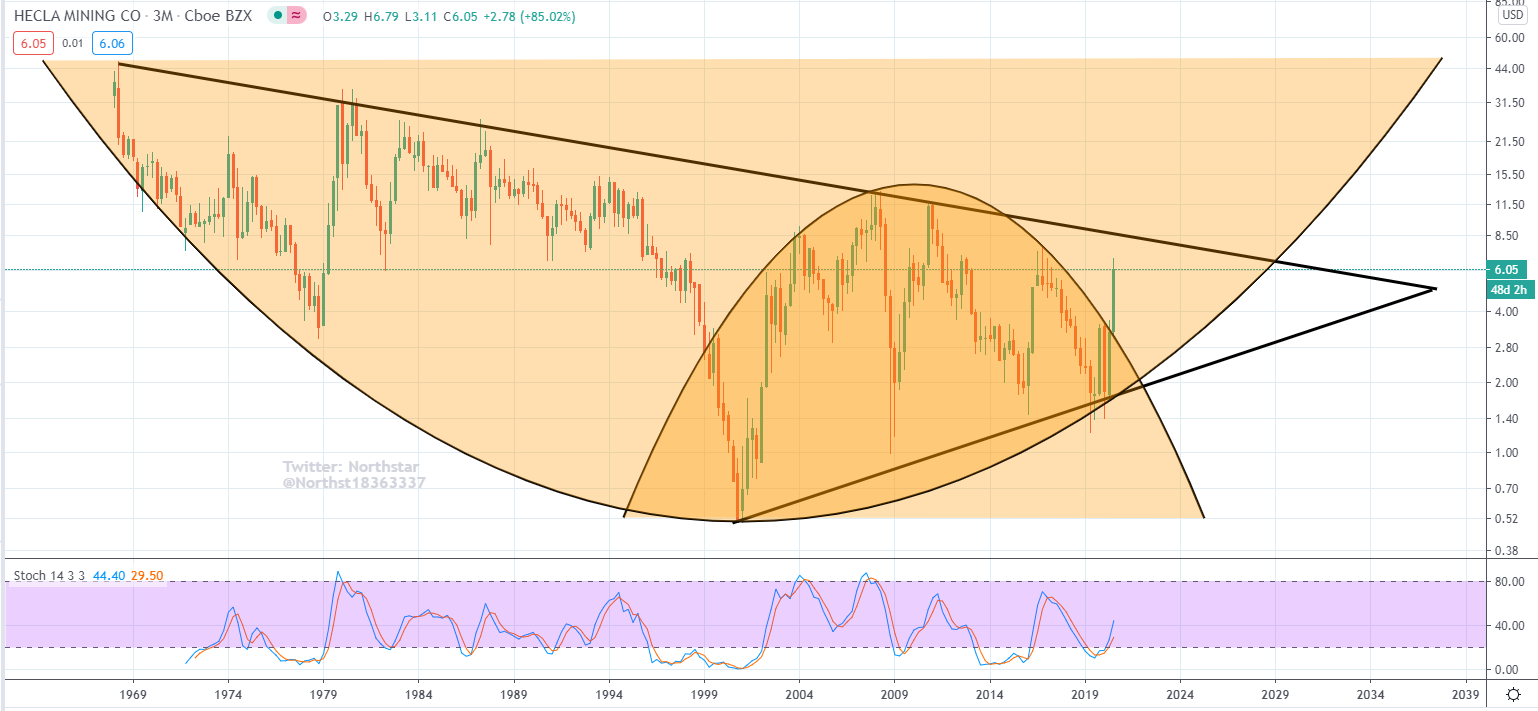
All over the place. Silver has broken out of it’s recent consolidation. Individual miners are breaking out…here’s Hecla
Gold & silver will give their verdict soon. I think I’m 60/40 in favour of an upside burst here before further drops in the next few weeks. I’m not really tempted to try and trade any of this. I’ll leave that for the 8 year cycle low.
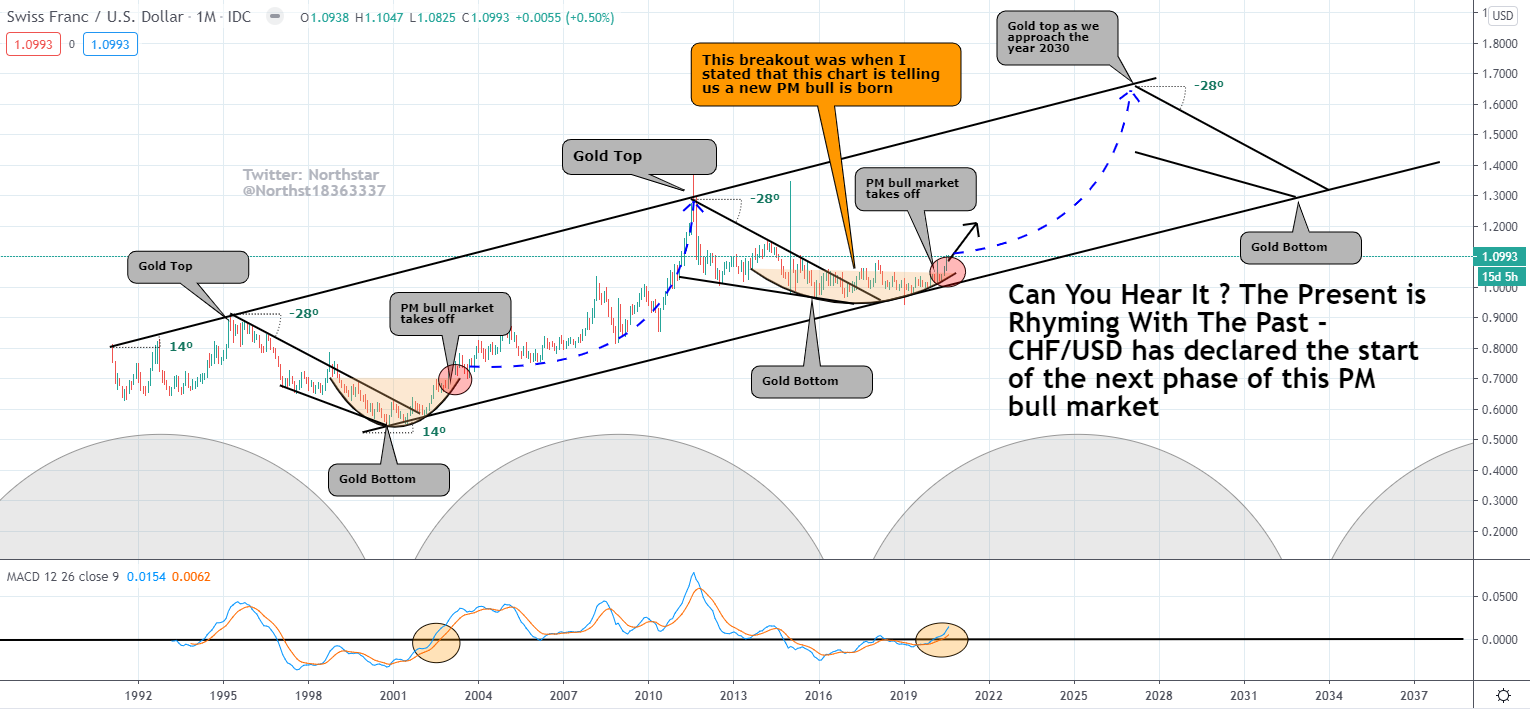
I seem to recall some comments when I first started highlighting this chart 2 or 3 years ago to the effect that the significance of this currency pair/ratio was history, and it should be discounted. The chart was very clear though. It was saying a new PM bull was about to start. I kept an open mind, but the chart has continued to respect all the support lines and signal that we are in the very early stages of a cyclical bull market in PM’s. The chart was right. It’s a good lesson in evidence gathering and not dismissing any pieces of the puzzle (for or against your own personal beliefs),
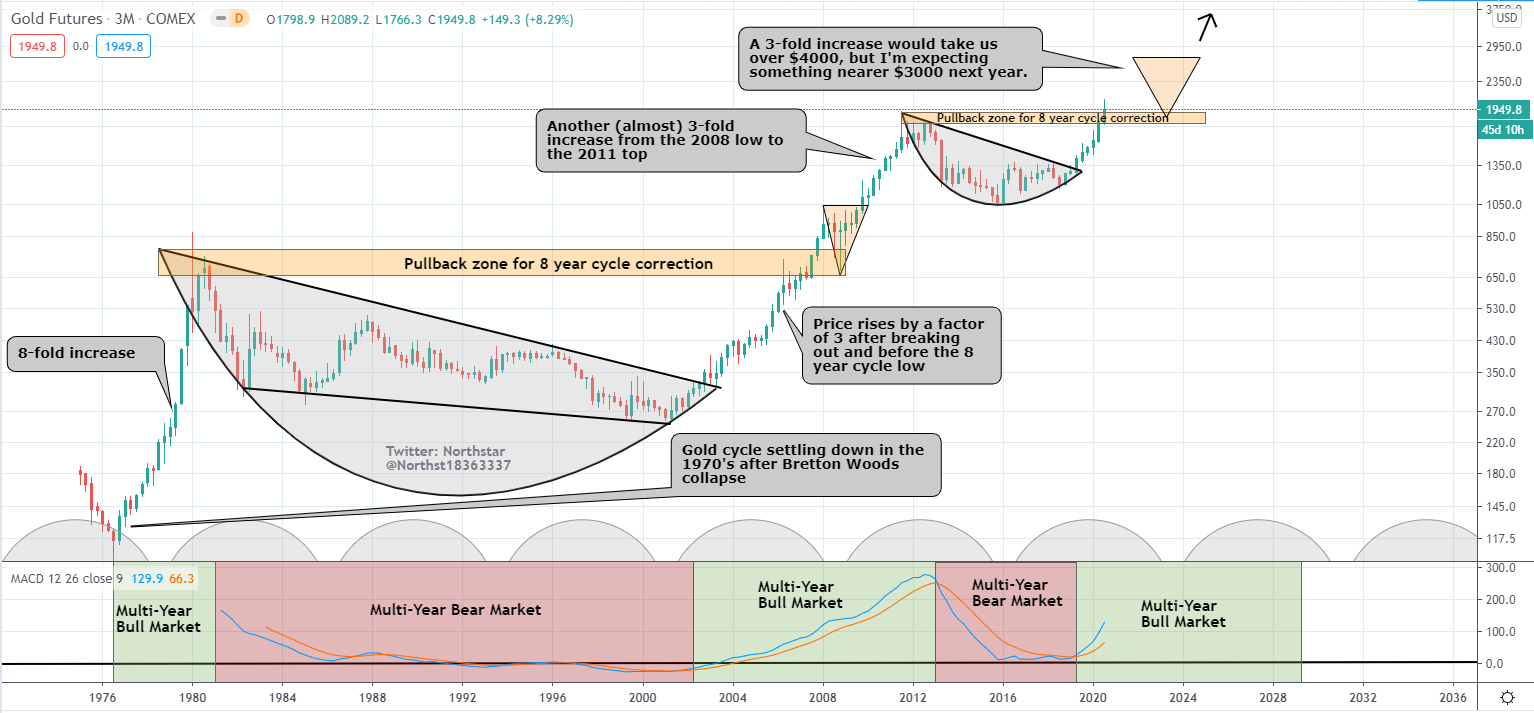
Following my silver ‘big picture’ chart, I thought I’d take another look at gold. It looks like we have a long way to go yet. Plenty of bumps along the way, to throw off the uninitiated investor. That 8 year cycle low remains the focus for my attention though.
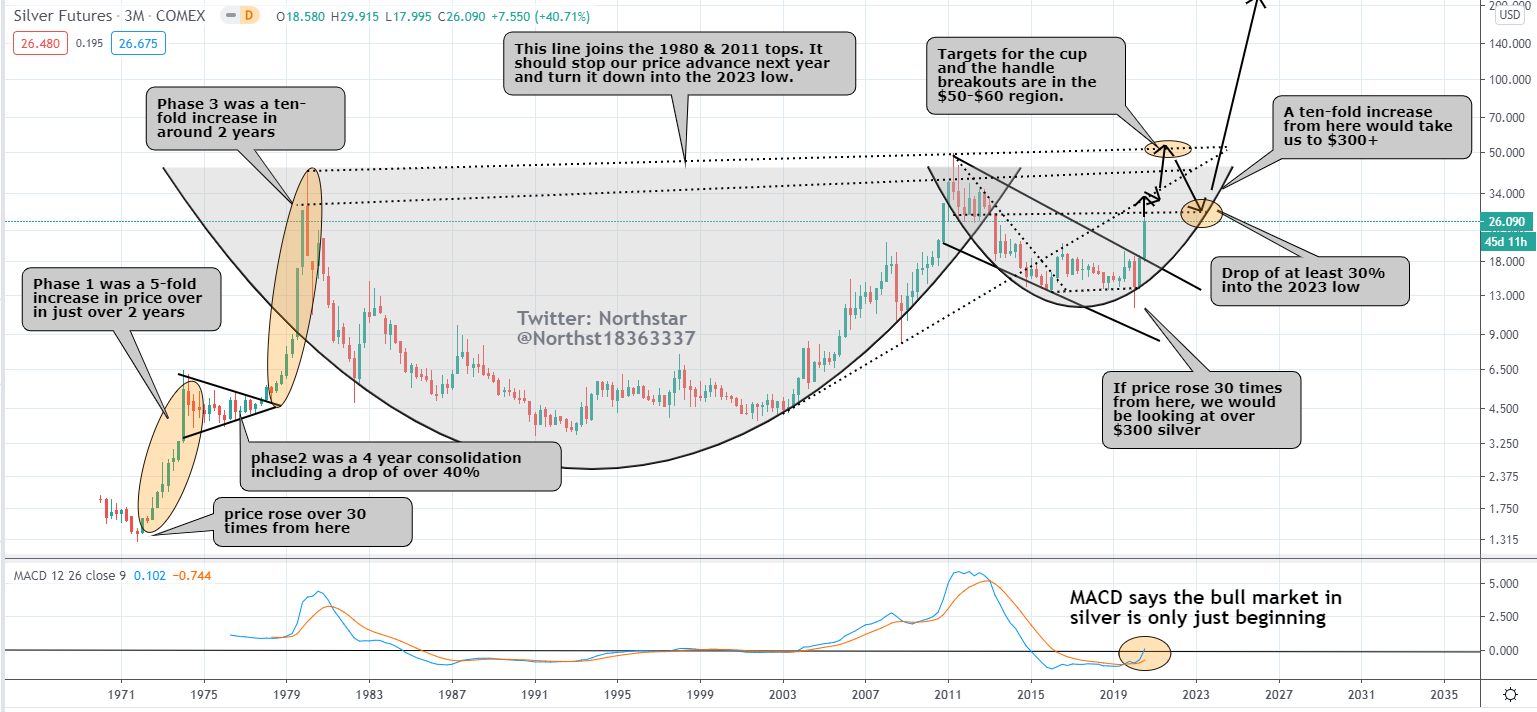
Stepping back and looking at the bigger picture for silver, it seems clear we’ve been getting so used to prices sub-$20, it’s coloured our view of the future. As I always say, just listen to what the chart is telling us. This chart is shouting at us through it’s public address system – it’s saying $50-$60 first, then a long (2 years ?) consolidating with a drop of at least 30%. After all that, buckle up for the ride of your life. We’re going ‘to da moon’.
Ok, so I’m being over-dramatic, but that’s basically what the chart is suggesting, crazy as it sounds. Something not good happens next year to cause the huge drop. Something very not good happens after 2023 to give us that moon-shot.
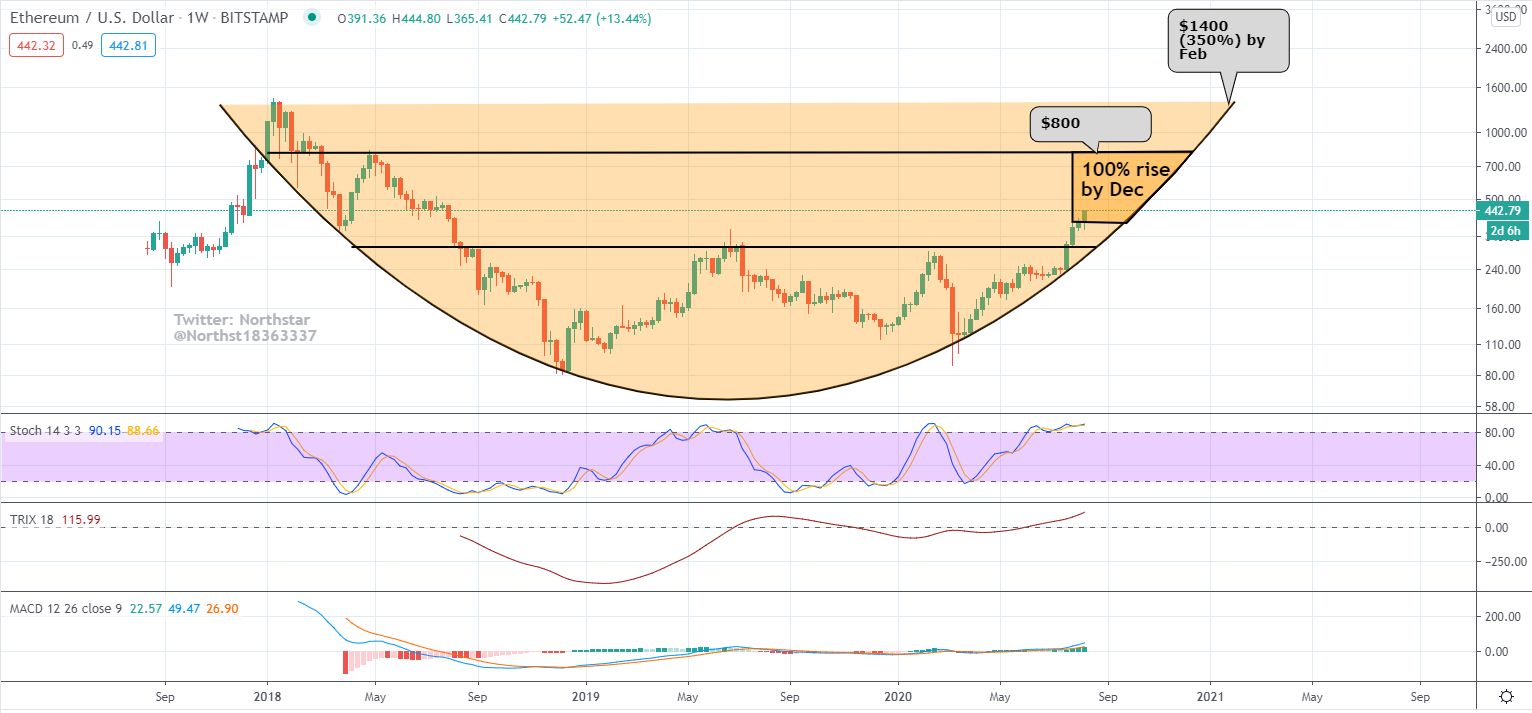
I posted this chart a while ago. My forecast was for a move to $800 by December (a 100% rise). So far we’re up 10%…
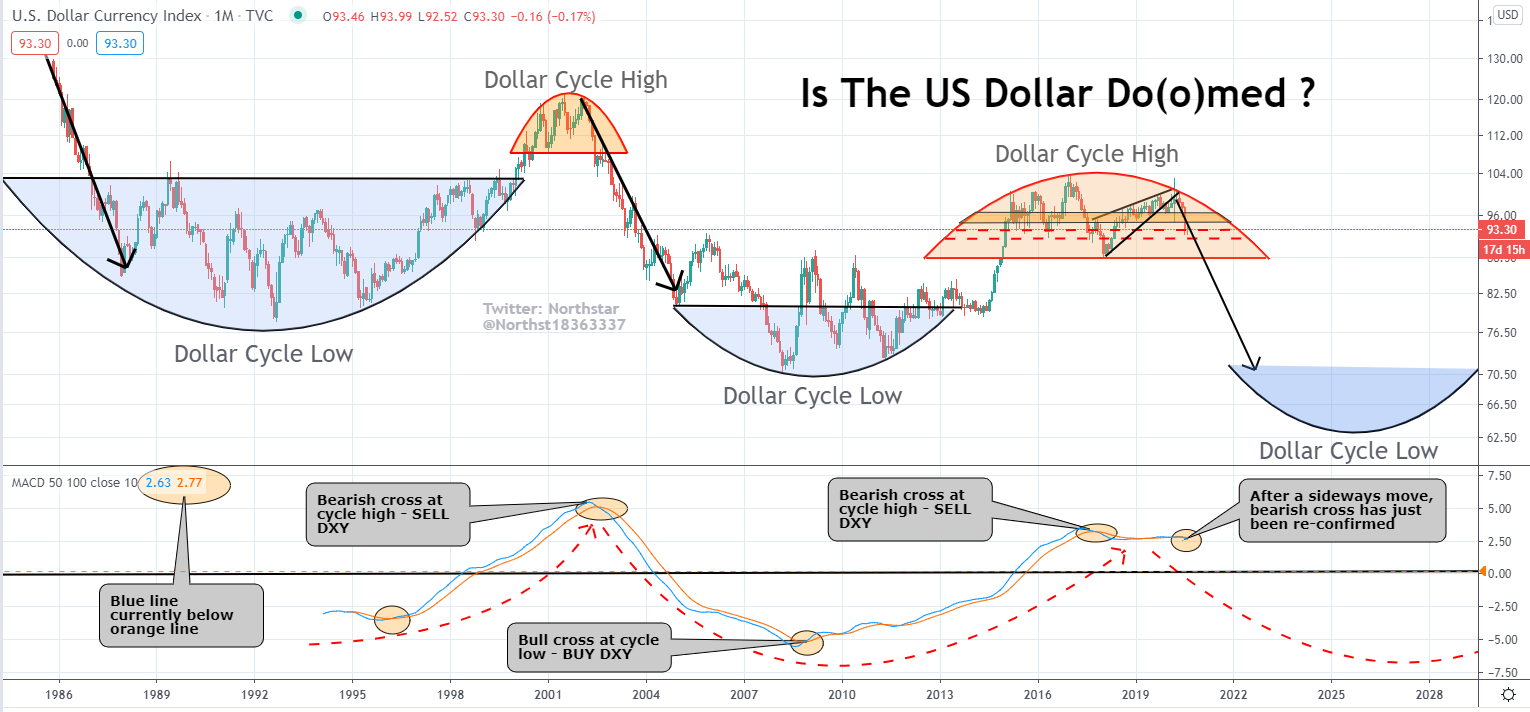
Another version on my big picture view. Important for PMs and commodities going forwards.
A reminder of my big picture view, and also a close-up of recent moves

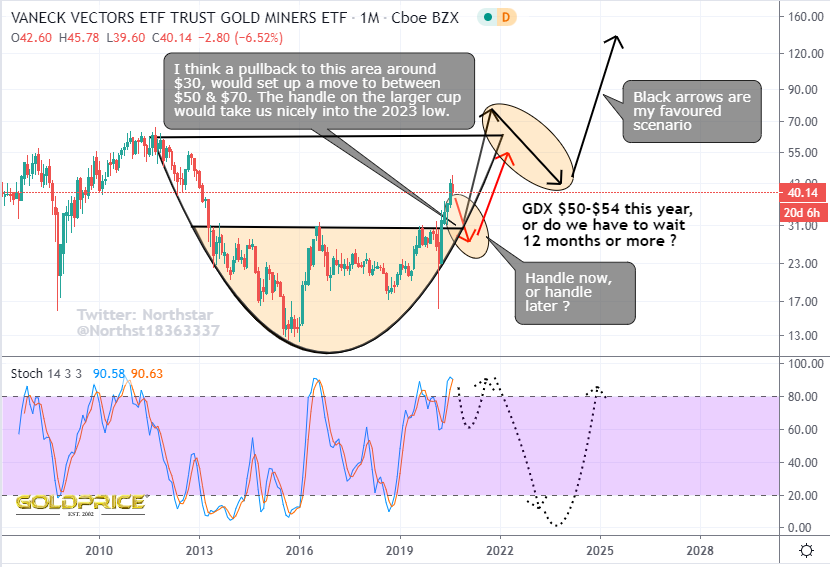
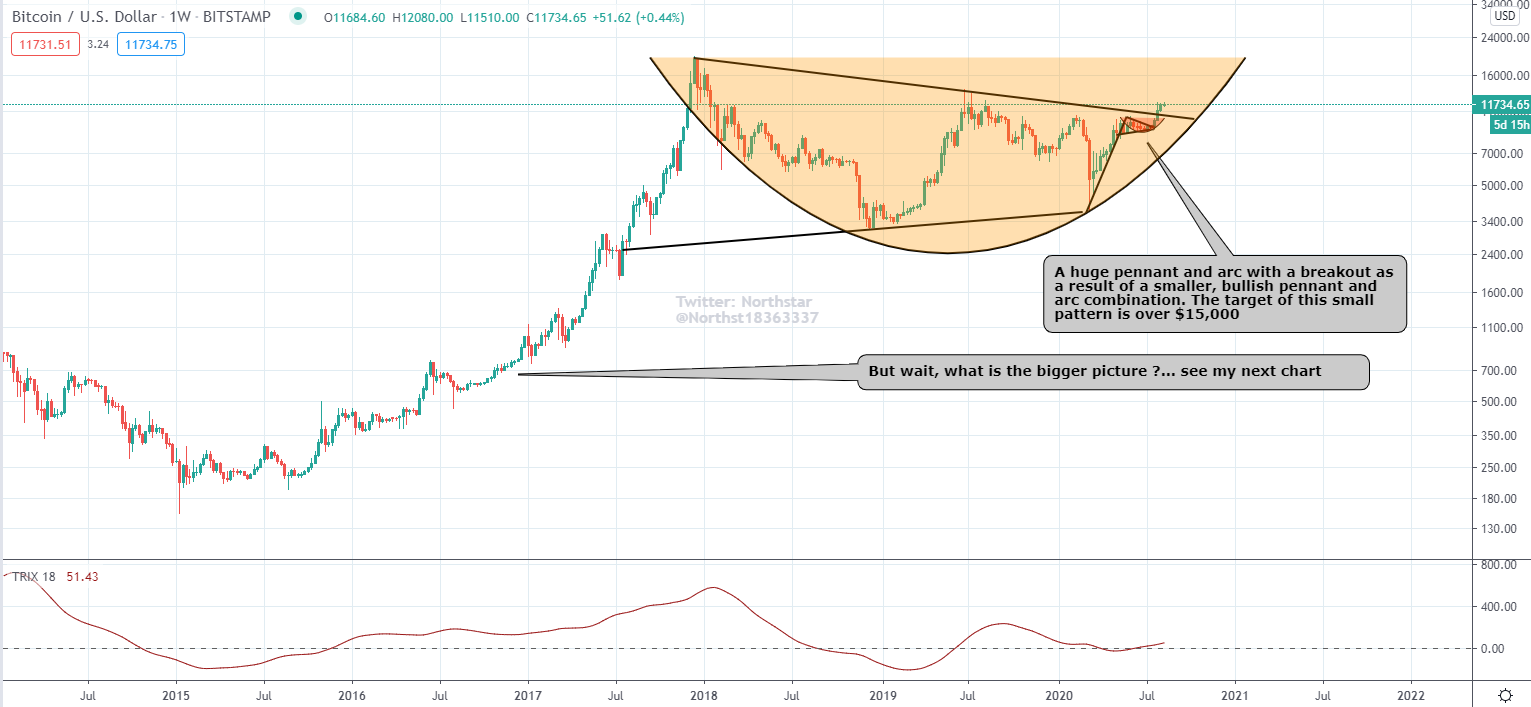
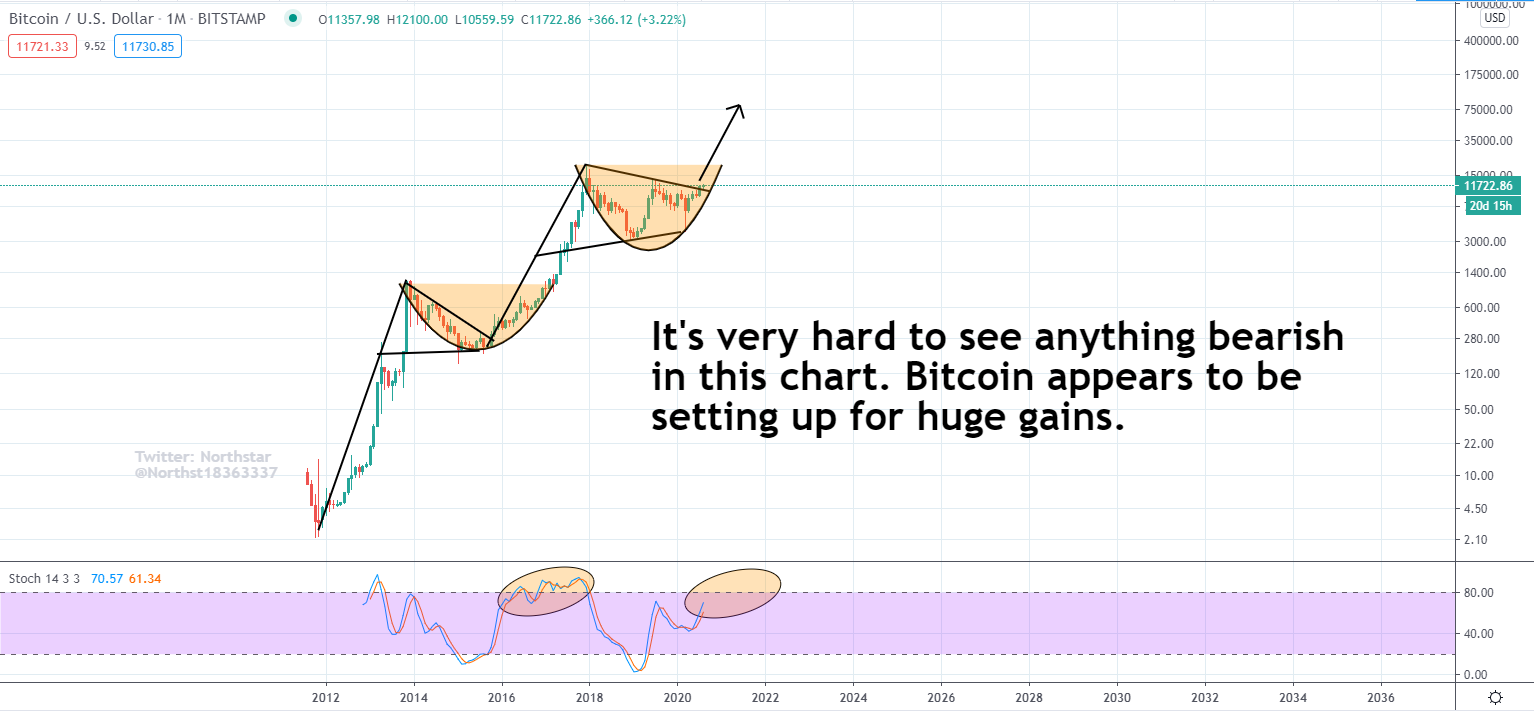
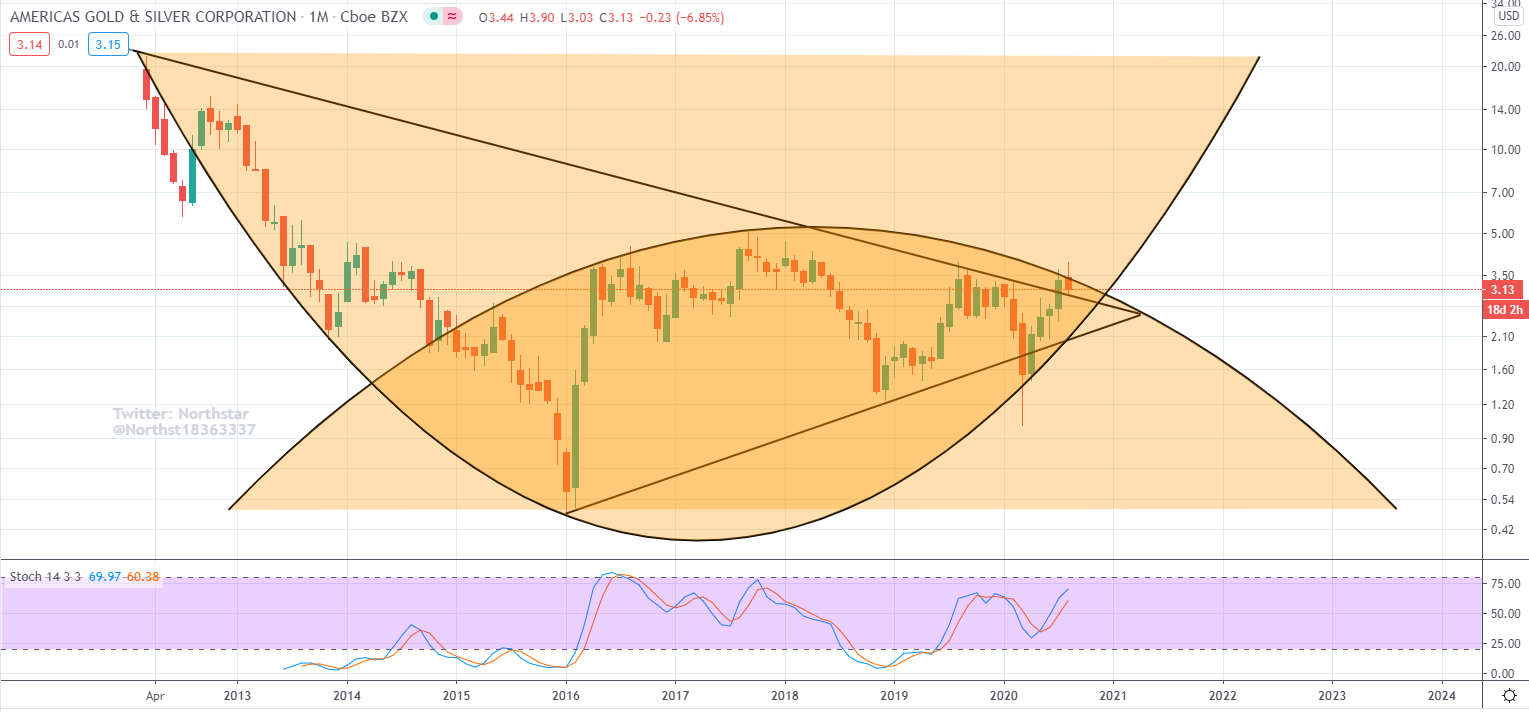
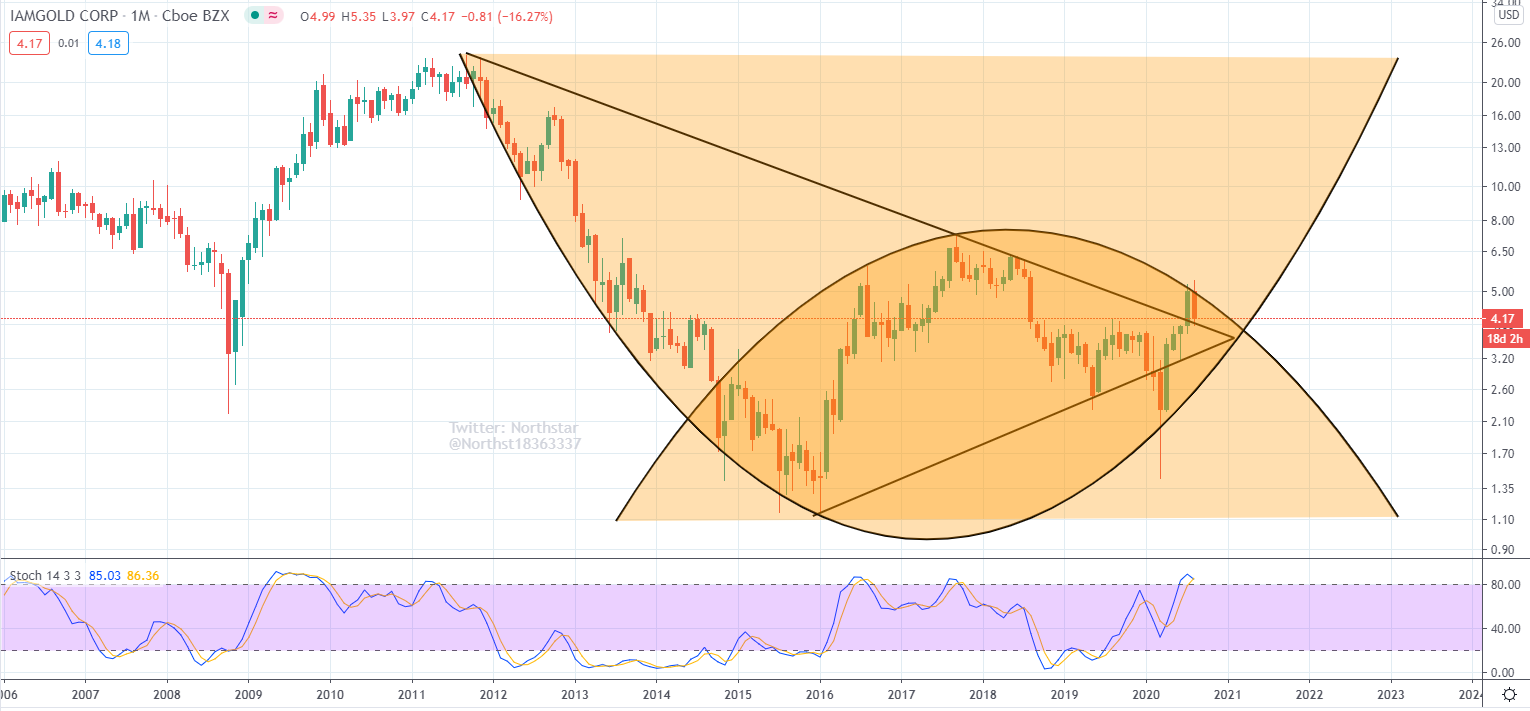
Battle of the arcs…
Definitely not investment advice, but the idea of being mentally prepared, having a plan and managing your own risk seems sensible to me.
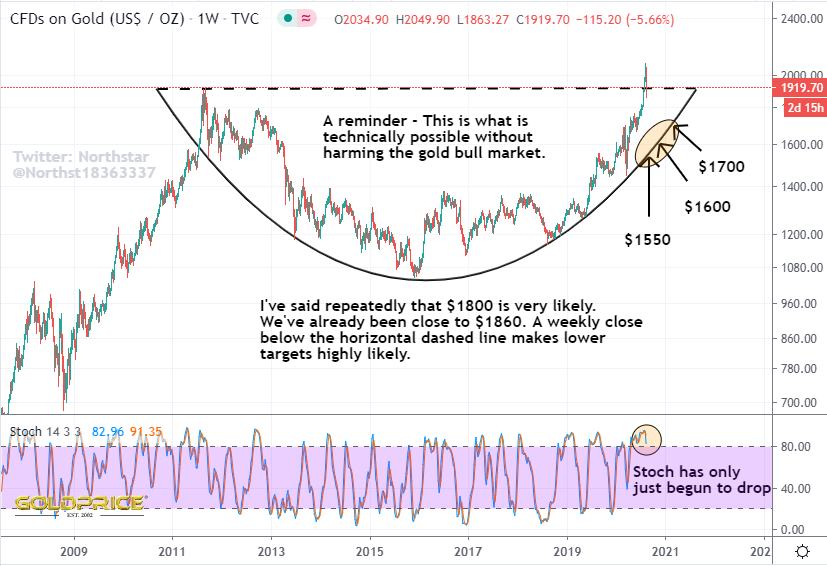
The line chart helps clear things up a bit, and it’s not a pretty picture. Combined with me expectations for a GSR bounce, we could see a 20%+ drop here. It would be a brilliant set-up for the next move…
The GSR alerted us to this correction ahead of time. More clues evident…
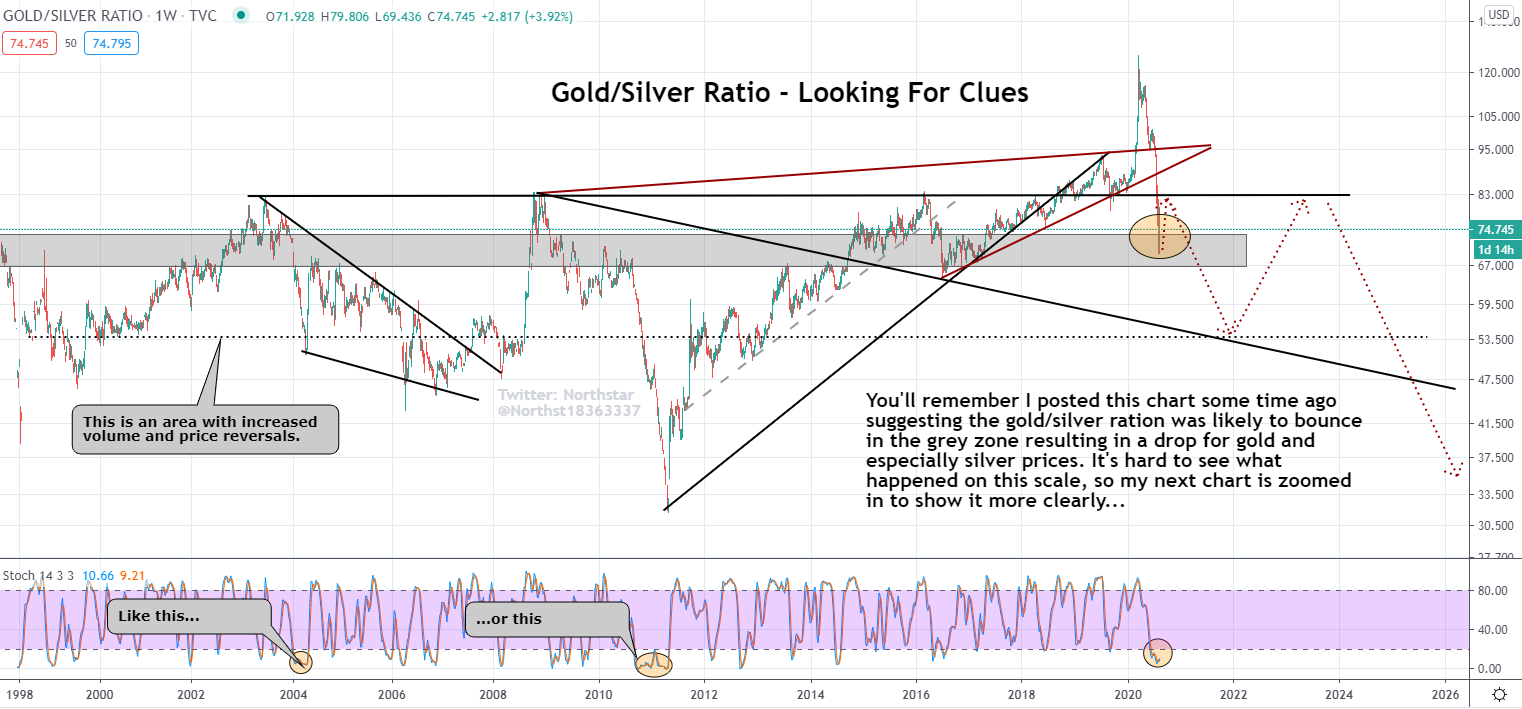
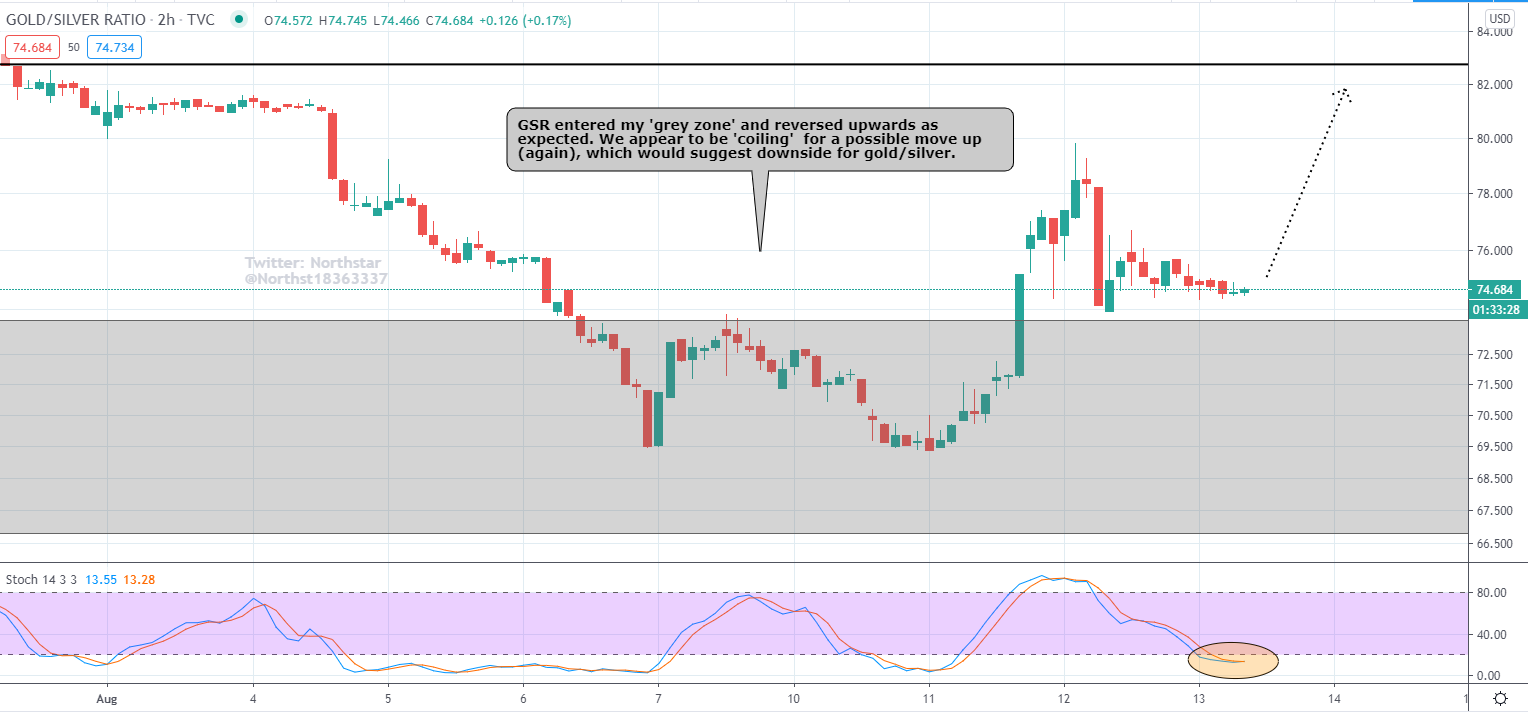
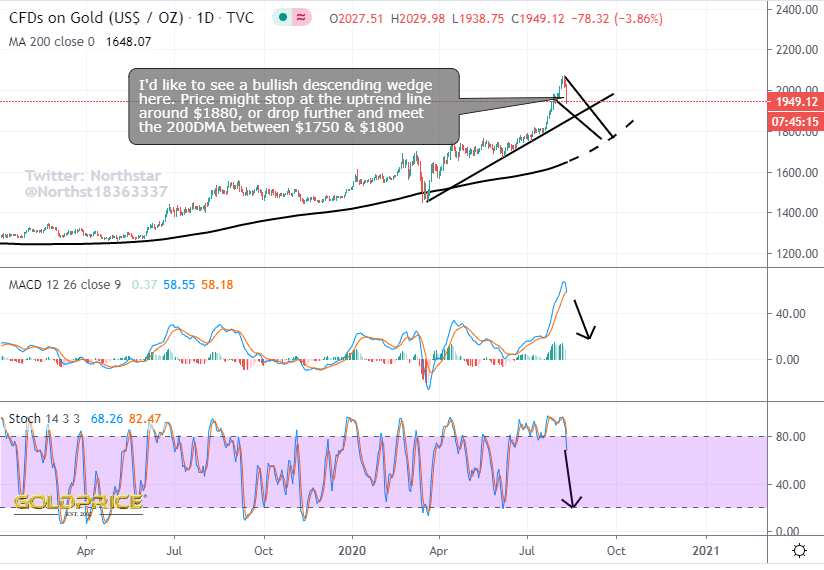
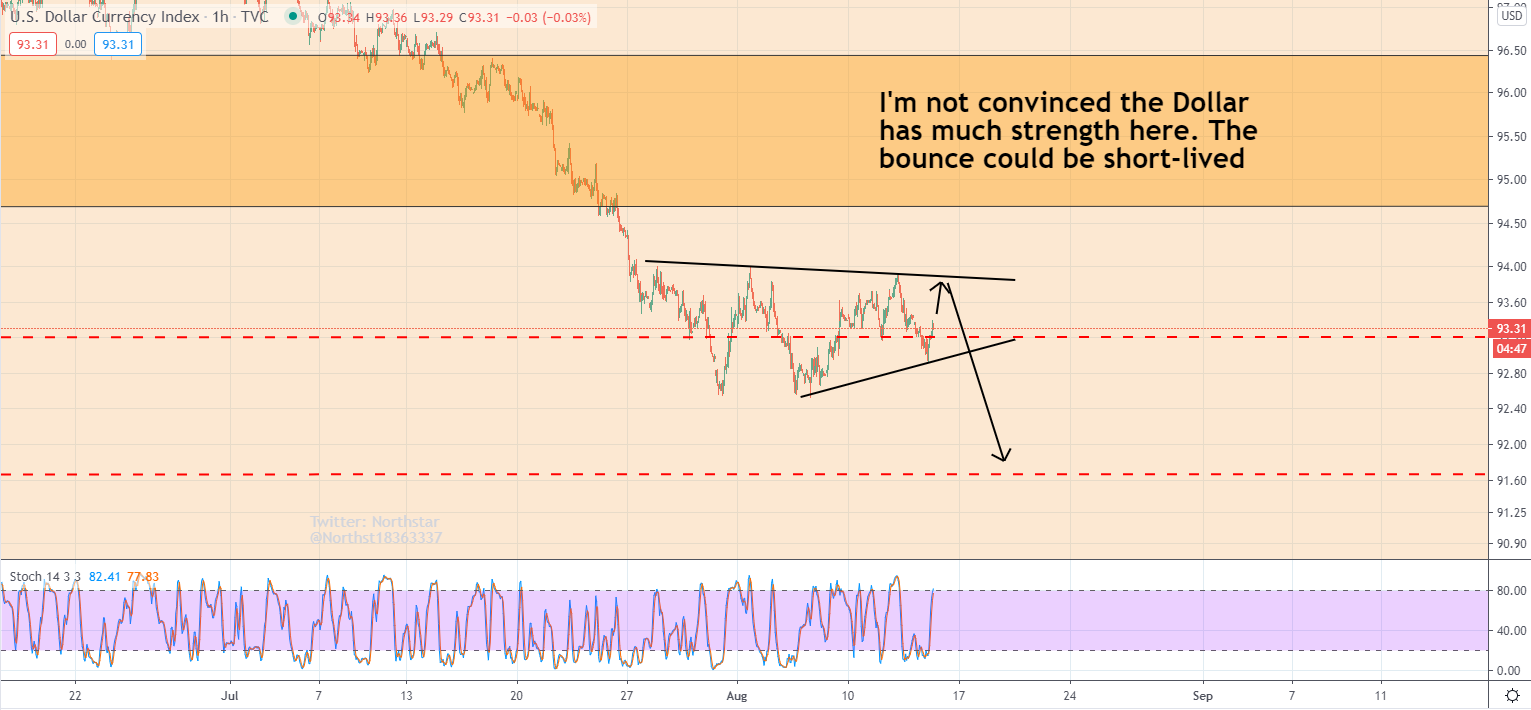
Currently (as I write), it’s bounced back up $75. I expect further declines to somewhere between $1700 & $1800. Here are the ‘big picture’ charts I’m keeping an eye on…
Edit: Close up added…
This was an absolute delight to analyse. Sometimes it takes a while to see the pattern, but this just jumps straight out at you…
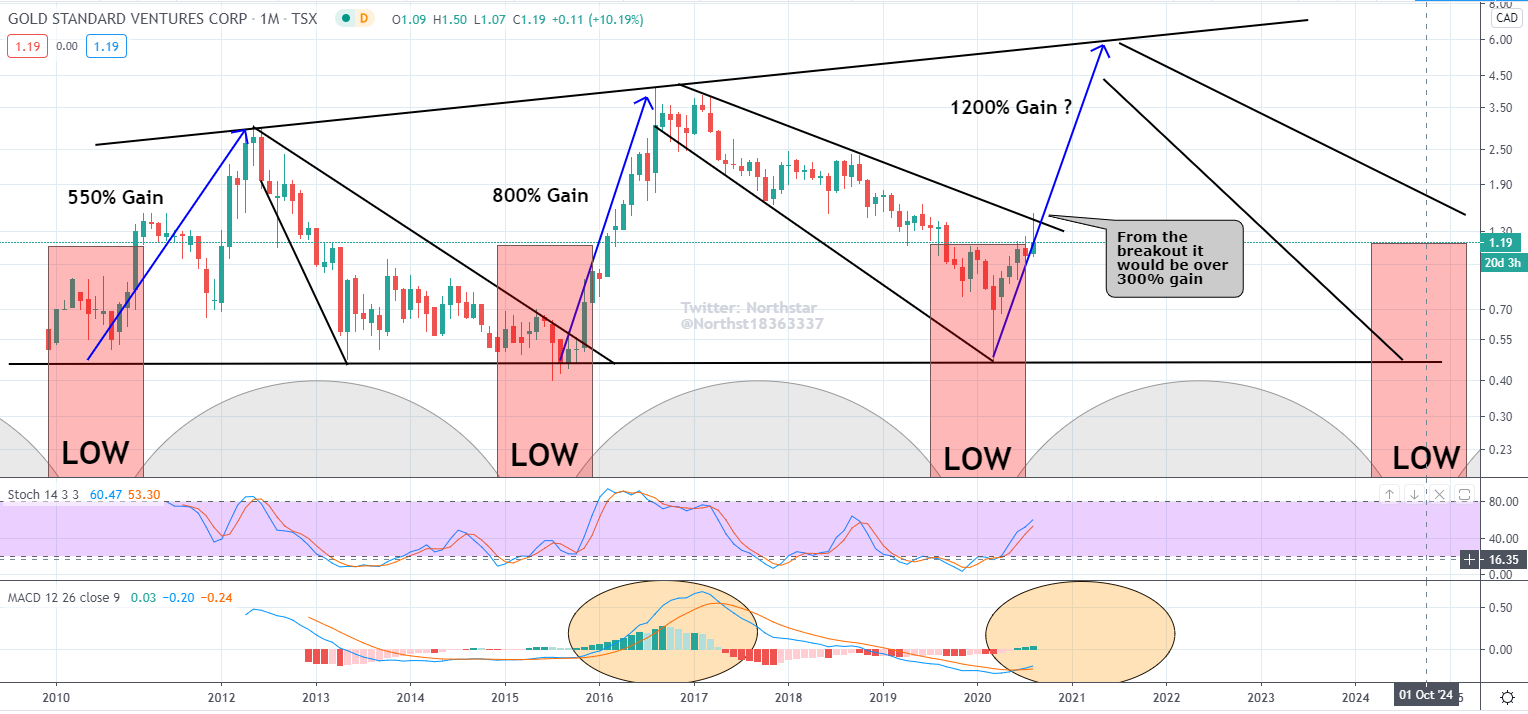
But how far ?