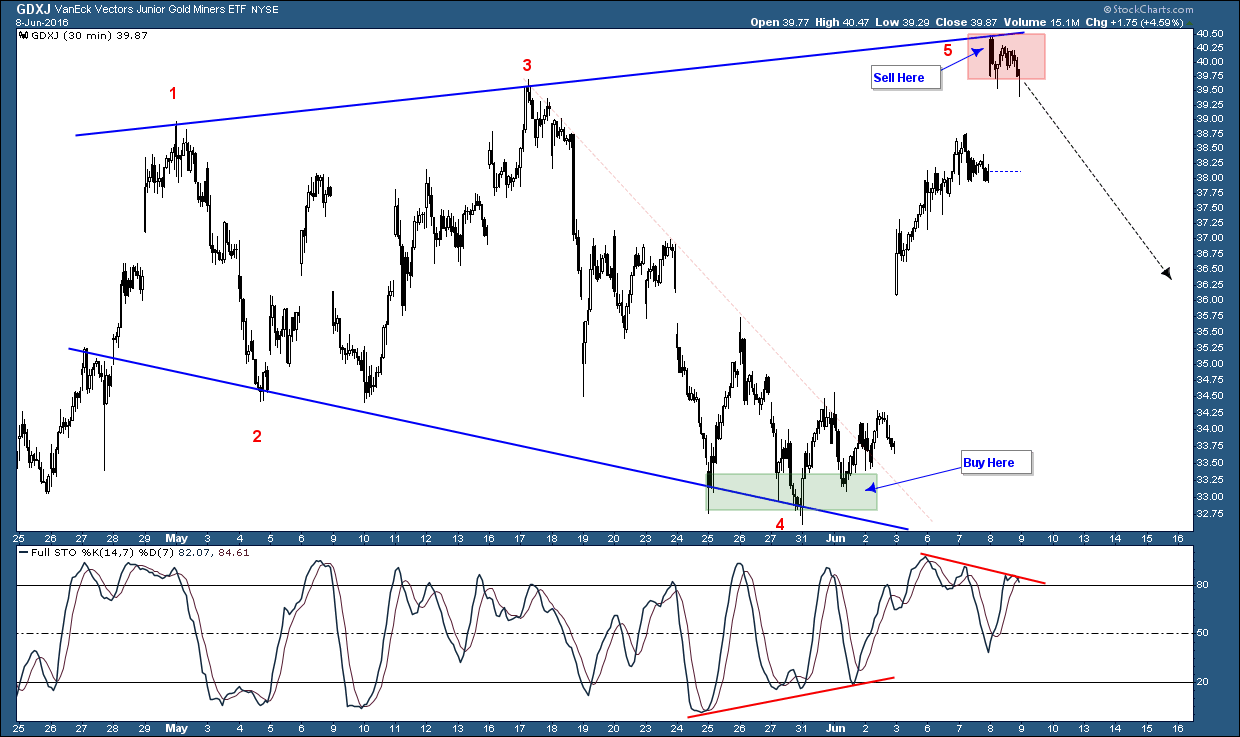
GDXJ

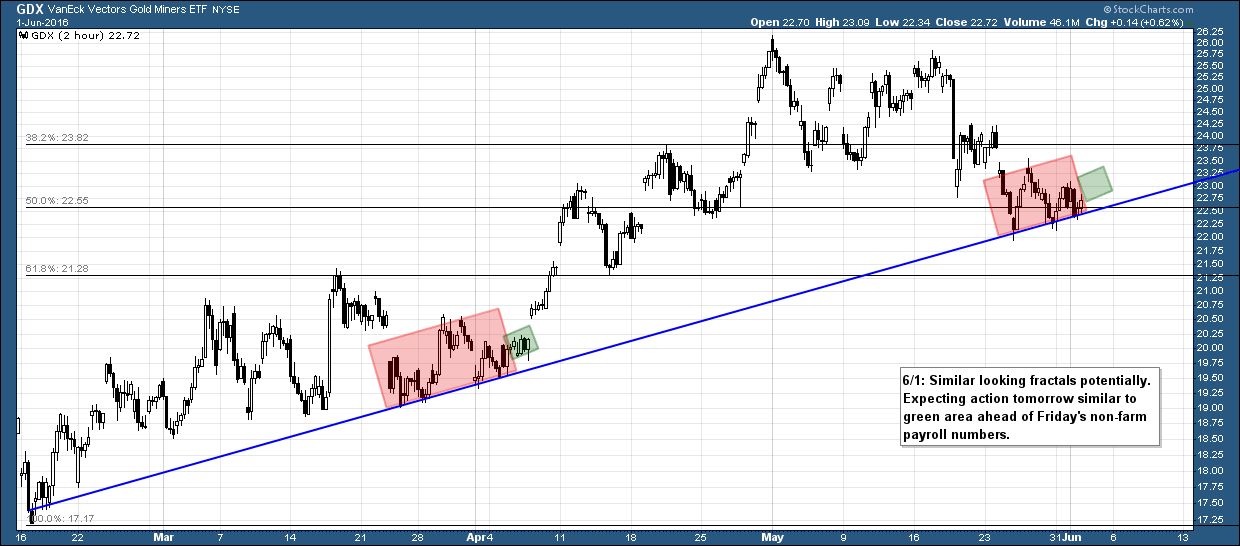
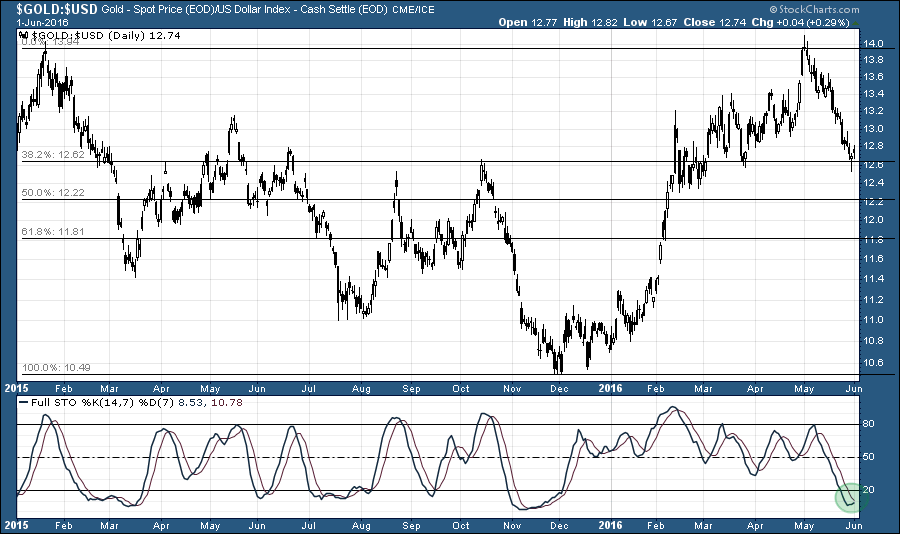
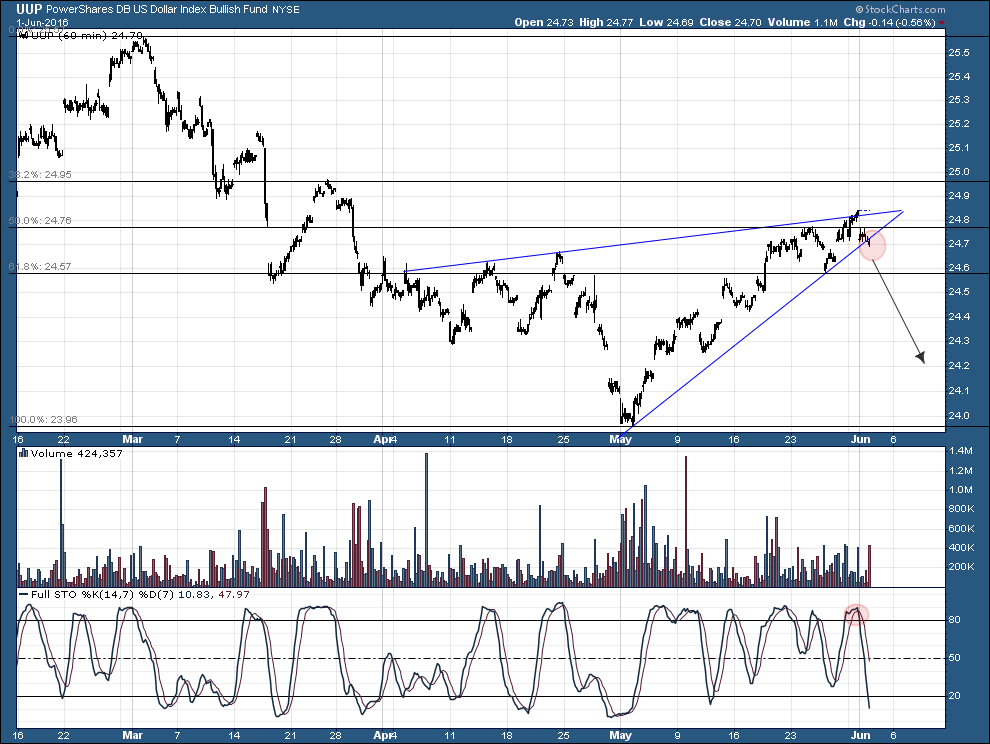
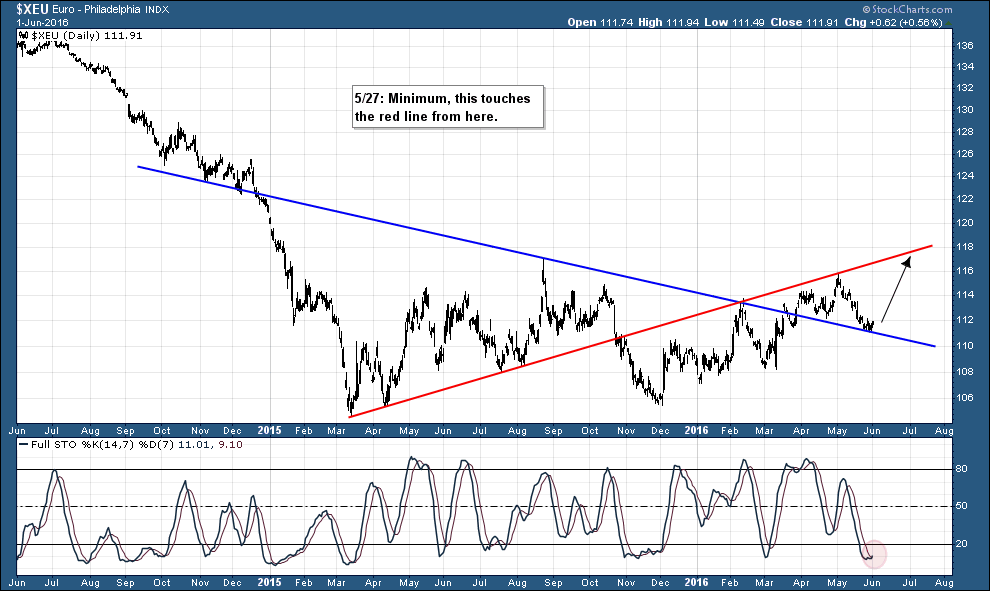
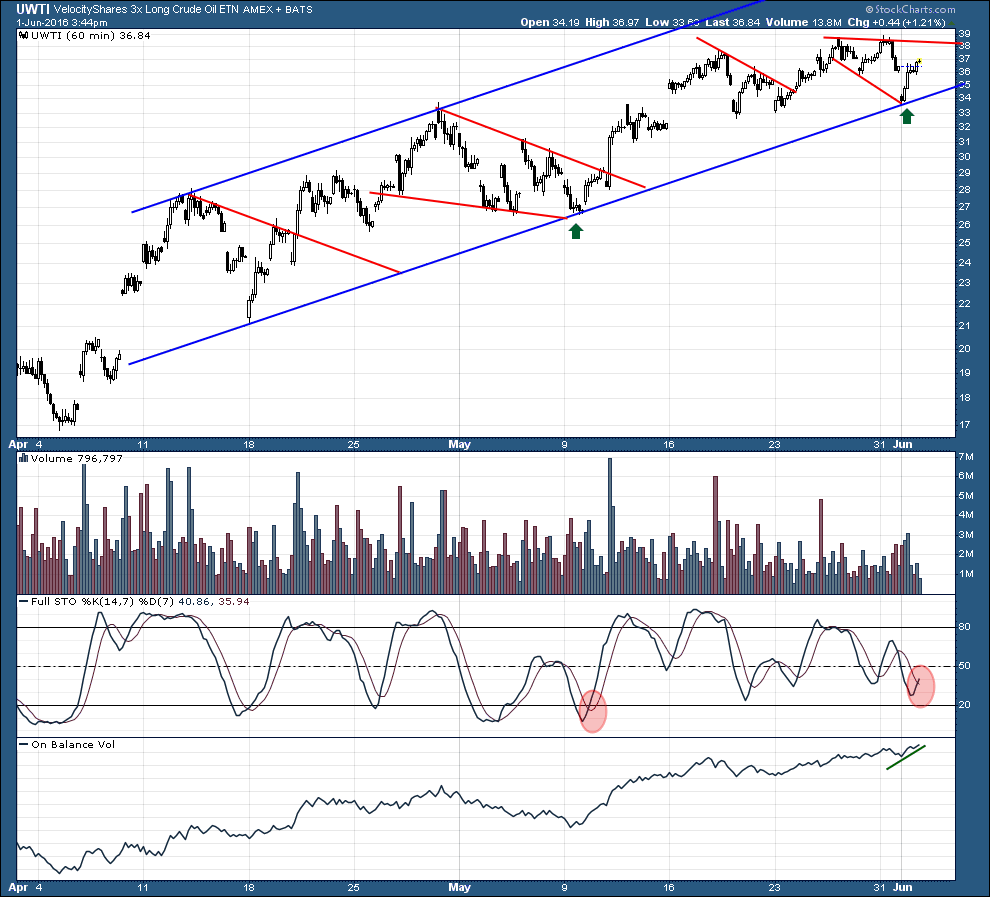
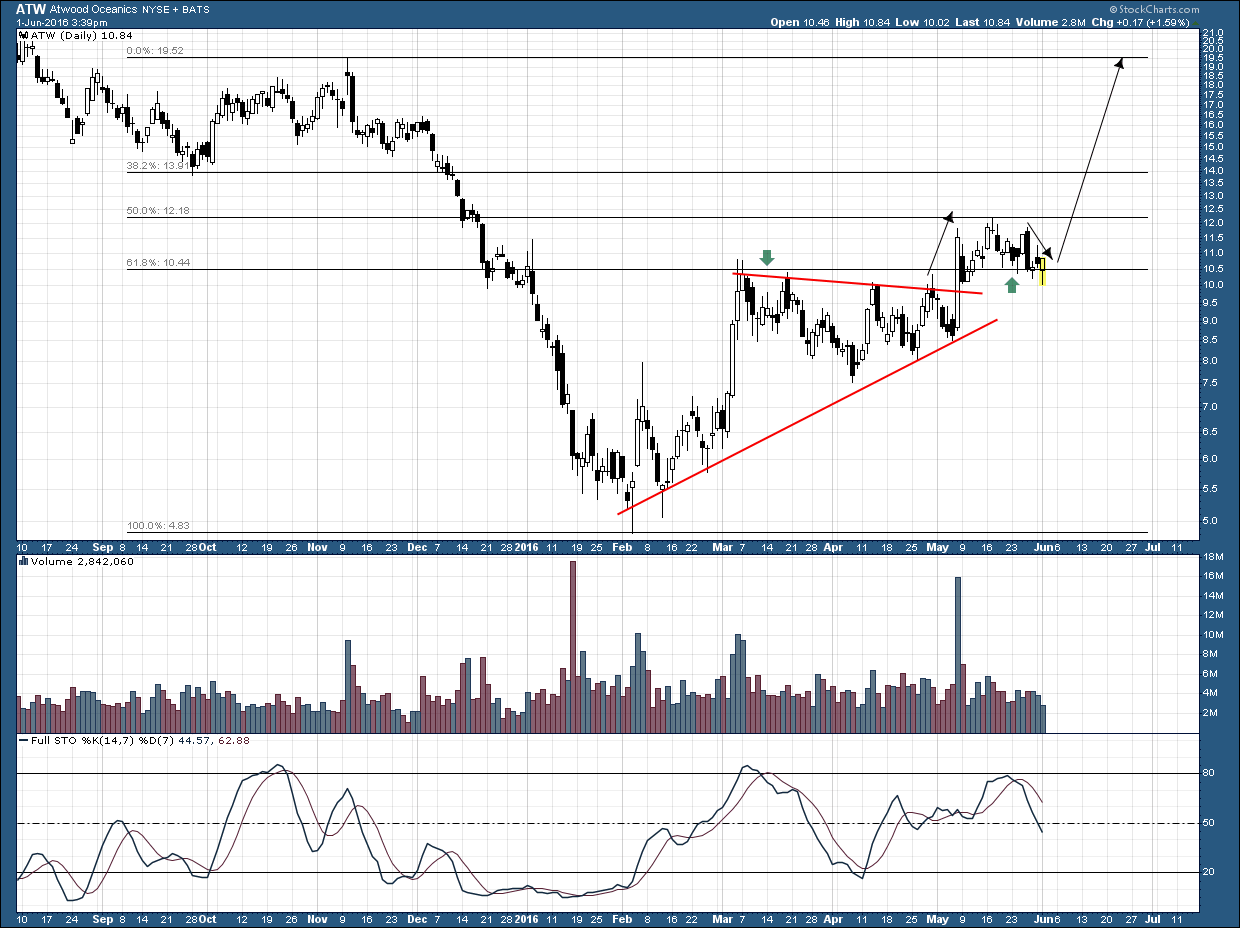
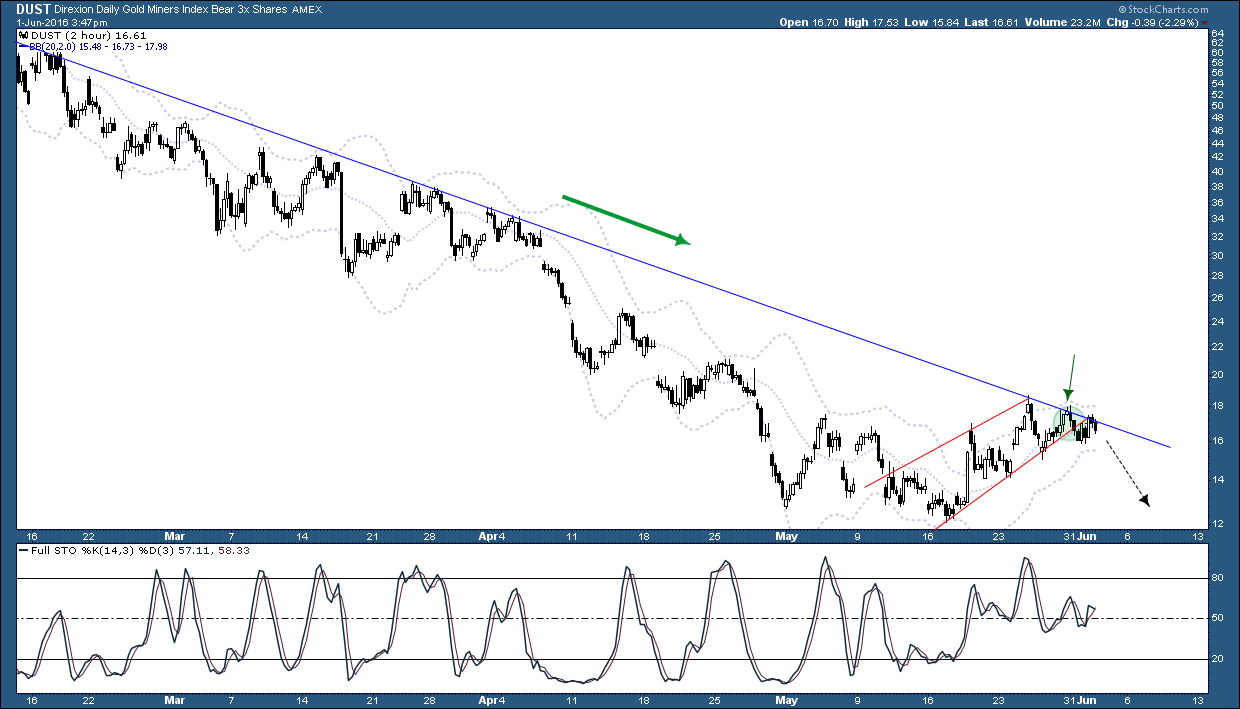
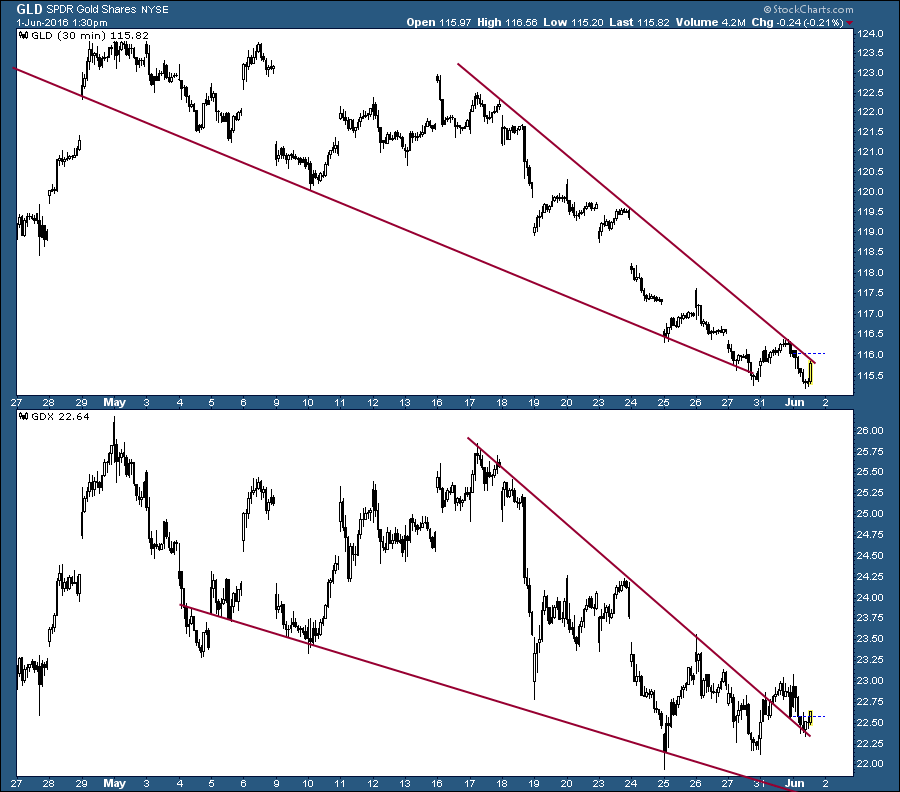
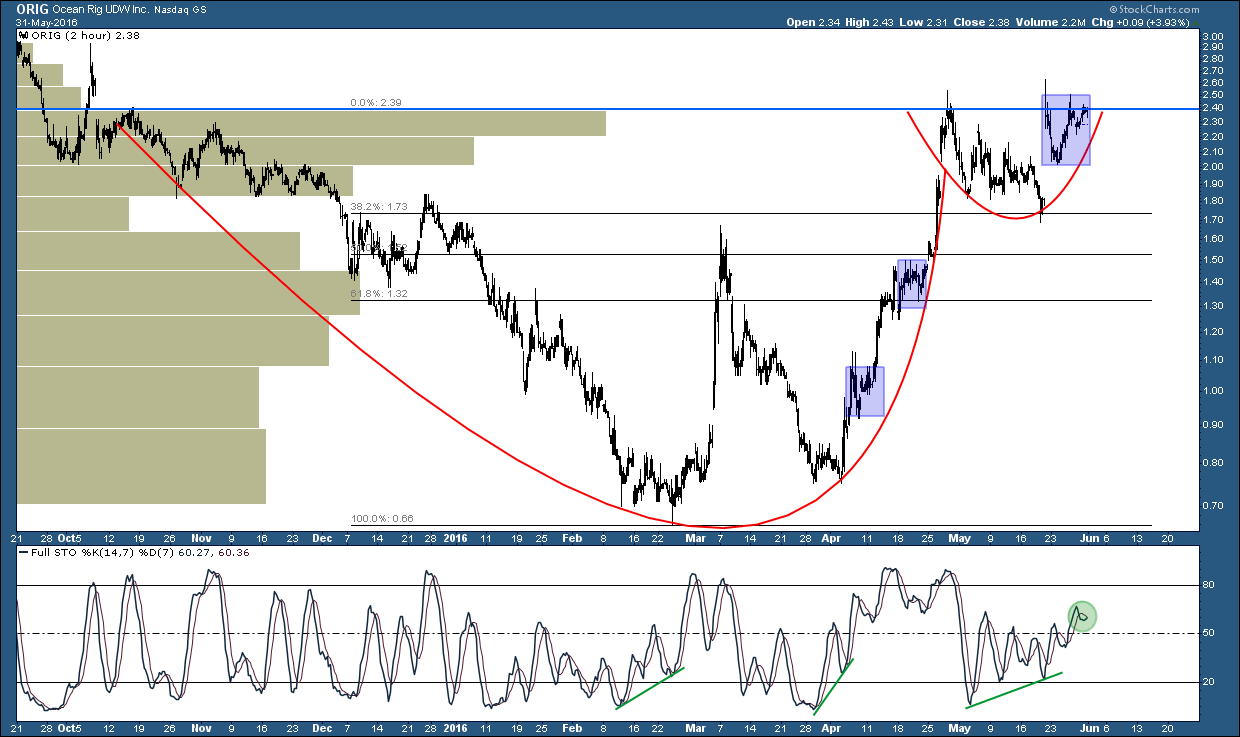
Here’s one of my charts today that prompted me to essentially liquidate everything this morning. I have a number of others that corroborate the basis of my trading decision. I’m not going to share every chart I rely on these days because I feel like I’m not doing myself any favors in that regard. I even bought a little DUST and JDST at the same time I sold longs which are now nicely profitable at the close. The weekly PM charts are still in good shape and what this suggests to me is that more consolidation may be needed before a sustainable breakout can occur. I had to protect profits which are almost obscene now and selling today saved me a bundle compared to where prices settled in at the close. I have my targets of where to start climbing back in long but I need to see how the chart structure evolves first. I’m neither bull nor bear…I simply trade what’s right in front of me.

GDXJ

Trimmed my PM Exposure Way Down Today

I didn’t expect to do this at all at this point in time but I really don’t like some of the structure developing in the miner charts, particularly in the GDXJ. I took a boatload of profits on shares I’ve held for more than 6 months. Things may chug higher here but I really have to protect profits on what is easily my best year ever….even in June. I will post some charts later explaining what I see….but I don’t like it.

IBB – Turned Away by Resistance – Long LABD

just went long LABD at 30.61. IBB is a total dog in an otherwise strong stock market and slammed into resistance in a downtrend.

IBB

ORIG – Just Took Profits

Same story as CHK….sell into strength and into resistance….don’t be a pig.

ORIG

CHK – Just took Profits

Just sold at 5.08. Nice quick runup from 3.70 but now at fib resistance. Sell into strength at resistance.

CHK

ORIG – Houston we have lift-off

ORIG Chart

and others I’ve been promoting for a while……..

ATW
ATW

CHK
CHK

Same Theme Now for Weeks/Months

When support is in control you buy the dips…….

S&P, Oil, GDX

Energy

Guys on Smart Money were shorting the S&P in mid May at the swing low and putting out sell recommendations on the likes of CHK at $3.70. I suspect they are on TV because they cant make money trading. Meanwhile CHK, ORIG, and ATW are all on fire today….I was positioned nicely….even if Gartman said a week ago that oil was a better bet to lose $5 than gain $2. Again…. this is why he makes TV appearances and writes a letter for a living instead of managing other people’s money!.

The Charts Just Don’t Support the SM Bear Case – – – Yet

It seems the herd is itching to nail the SM exact top and many big name investors have been shorting the S&P for weeks and months. I trade what’s right in front of me and I cant find the bear case in the chart structure at current levels. From a market psychology standpoint, if the SM moves up to all time highs from here before finding a major inflection point, that will likely make the most number of losers out of market participants. With that said, if prices do move up to make marginally higher highs, perhaps around 11,500 on my $NYA chart, that would open the door for a bearish shark pattern to come into play for those familiar with harmonic patterns (i.e Gartleys). For now, at least from my perspective, it appears the bears are absolutely guessing that we are at market top because I cannot find a shred of chart evidence to support it….while I see a lot of chart structures supporting higher prices from here. I hear most of you guys citing fundamental evidence that prices should fall from here….horrible economic growth/earnings, historical statistics, etc…..but we are chartists here and could care less about what is “supposed” to happen from here. That’s all just biased talk to me. Just watch how quickly you will blow up your account trying to trade overblown P/Es, record put/call ratios, extreme sentiment indicators, etc….sorry guys, that’s just how I see it…which doesn’t mean squat I know but it’s a perspective.

NYA

ERX

I really like the structure of this one.

ERX

Gurus Are Befuddled

Clearly these guys have absolutely no clue what’s going on here. Their troops are growing restless…it’s going up, then down…or wait still down really hard until July then up strong…or wait, let’s see what happens Monday….or ummmmm….

WEEKEND CHART – Gold

On May 27th MA published this:

Market Update

This is looking like what can only be described as an “Epic fail” on his part. How could the man with the flawless model not know to be buying at $1,206 instead of insisting hitting that level means we are en route to sub-$1000??????

Same Theme – PMs and Energy

I see gold forging ahead towards my $1,371 target and oil heading towards my $62 target over the next month as my view of the charts suggests the $USD’s underlying support is now down at 90.10. I think the euro is heading for 1.23. I’m looking at potential doubles in many of the stocks in these sectors.

Gallo – Energy Sector

I use the XLE as my guide on energy sector. As posted back in April, this remains my view until the structure is no longer valid:

XLE

Guru Update – Mostly Wrong!

The charts confirm what the minority have been saying here for the past couple of weeks…we are in an uptrend and the consolidation has been healthy and support can be bought. Meanwhile the Savages of the world are getting paid to give people the wrong advice while we are on the right side of the trade and it’s a free public service thanks to FGC 😉

AEM breaking to fresh highs today out of what was indeed a healthy consolidation.

AEM

From original my post………….

Prices MUST Retrace to March Consolidation Zone?

S&P

Note how my Wolfe Wave target line first posted here a couple of weeks ago is morphing into support. Be careful with your aggressive shorts….

SPX

Energy Setting Up for Next Upmove

ERX

Just added to my ATW position at 10.26.

TLT – What the Action in Bonds is Telling Me

see notes on chart – – –

TLT

I also notice quite often that the pattern breakouts in TLT front run the GDX breakouts by a few days as shown below…

TLT GDX

NYSE Composite – Careful if You’re Looking to Pounce Short

Here’s a repost of my May 19th chart. The underlying structure continues to look more bullish than bearish. A break out of my shaded fib zone will confirm the direction of the current swing move, however my bets are all aligned more on the bullish side right now. This view matches my take on the currency charts which I see sending the dollar lower very soon. We’ll see but so far nothing has changed in the past couple of weeks. Apparently I have been using a variation of what Avi calls Fibonacci pinball for over 10 years now. I’ve always liked fib grids to anticipate support and resistance levels that aren’t intuitive with just simple trendlines.

NYA

Also check out the action in junk bonds. Conditions are ripe for this SM move higher to get extended. It may not end well!….but it’s moving higher for now.

HYG

NUGT Revisited

chart from May 25…still holding its case…..it’s all about support and resistance…and having some patience.

NUGT

GDX 2-Hr Fractal Update

from yesterday….playing out exactly according to script. Don’t expect any impulsive moves until tomorrow.

GDX

GDX Fractal?

Really like the structure here…don’t expect much movement tomorrow as we wait for Fri’s employment situation.

GDX

Gold/USD Ratio

Randomly bouncing on some nonsensical, technical fib level following a gorgeous hammer candle.

Ratio

Meanwhile we watch UUP & USD start breaking down….

UUP

USD

and non-US currency break out of a bullish wedges that we identified last week which were sitting at supportive levels….

XSF

EURO

Buying Dips in Strong Uptrend

Anyone trying to short the S&P, oil, or PMs are having a rough time right now as tags to support (with underlying bullish structure) are getting their collective arses handed to them. I added more ATW today at the gift price of $10.05 when I saw UWTI tag support (also midpoint of Bband). I was placing a calculated bet that ATW would manage to close above support fib level today. If it didn’t I would simply stop out with littel damage. Good risk/reward and it paid off.

UWTI

ATW

DUST relentlessly rejected at the TL under bearish structure. Adding PMs on tags to the TL have been like hitting an ATM.

DUST

Wait for bearish structure and volume patterns to emerge at resistance instead of just guessing that prices have gone too high or sentiment is at an extreme. We’ll leave the guessing and hoping to the gurus. It’s really a shame that technical analysis and interpretation of chart patterns never works 😉

GLD vs GDX

Miners typically break out of these patterns before the metal. GLD is almost there too now…

GLD GDX

$WTIC

Why is everyone so giddy about the prospect of shorting oil here? The move on the monthly is just getting started and there is no fib resistance or even much volume supply until you get to $62. Not a great risk/reward short entry here. This is the same chart I’ve been posting here for months.

WTIC

It’s also encouraging today to hear Dennis Gartman say that he’s leaning towards selling oil right now, although not aggressively yet. He said today that “oil is more like to go down $5 than up $2.” He also famously declared in January that we wouldn’t see $44 oil again in his lifetime. Maybe he was told he only had 3 months to live? He must be the most consistently wrong guru to be brought on TV so frequently….very entertaining to see him come up with these projections based on….ummm…nothing more than guessing.

gartman oil 44

ORIG

Chewing through supply and looks very close to breaking out of the this c&h. Fractal similarities in structure shown in blue.

ORIG

Still gorgeous structure on the weekly as prices consolidate between the fibs. I see this at $3.80 pretty quickly on the next breakout.

ORIG weekly

Natgas

Nice move in the commodity today. I’m liking my CHK here even if the guys on Fast Money called it a sell last week. They were all also shorting the S&P at 2040 over a week ago. 😉

Natgas

KLDX – Candle-of-the-Day Award

Engulfed the last 4 days on good volume and parked at wedge resistance right now under heavy accumulation. I just added this one last week with an average price of $3.22.

KLDX

Those Shorting S&P

Careful guys shorting the S&P here. If 2091 holds on the hourly, I’d exit that trade pronto with any profits you may have snagged. I will post a chart later.

EXK Update

Same chart I’ve posted for weeks….no updates, just behaving perfectly between the fibs. You had a rare opp to add below $3 today. My average cost remains below $1.40.

EXK