XAU to Gold ratio alerts bottomz in????
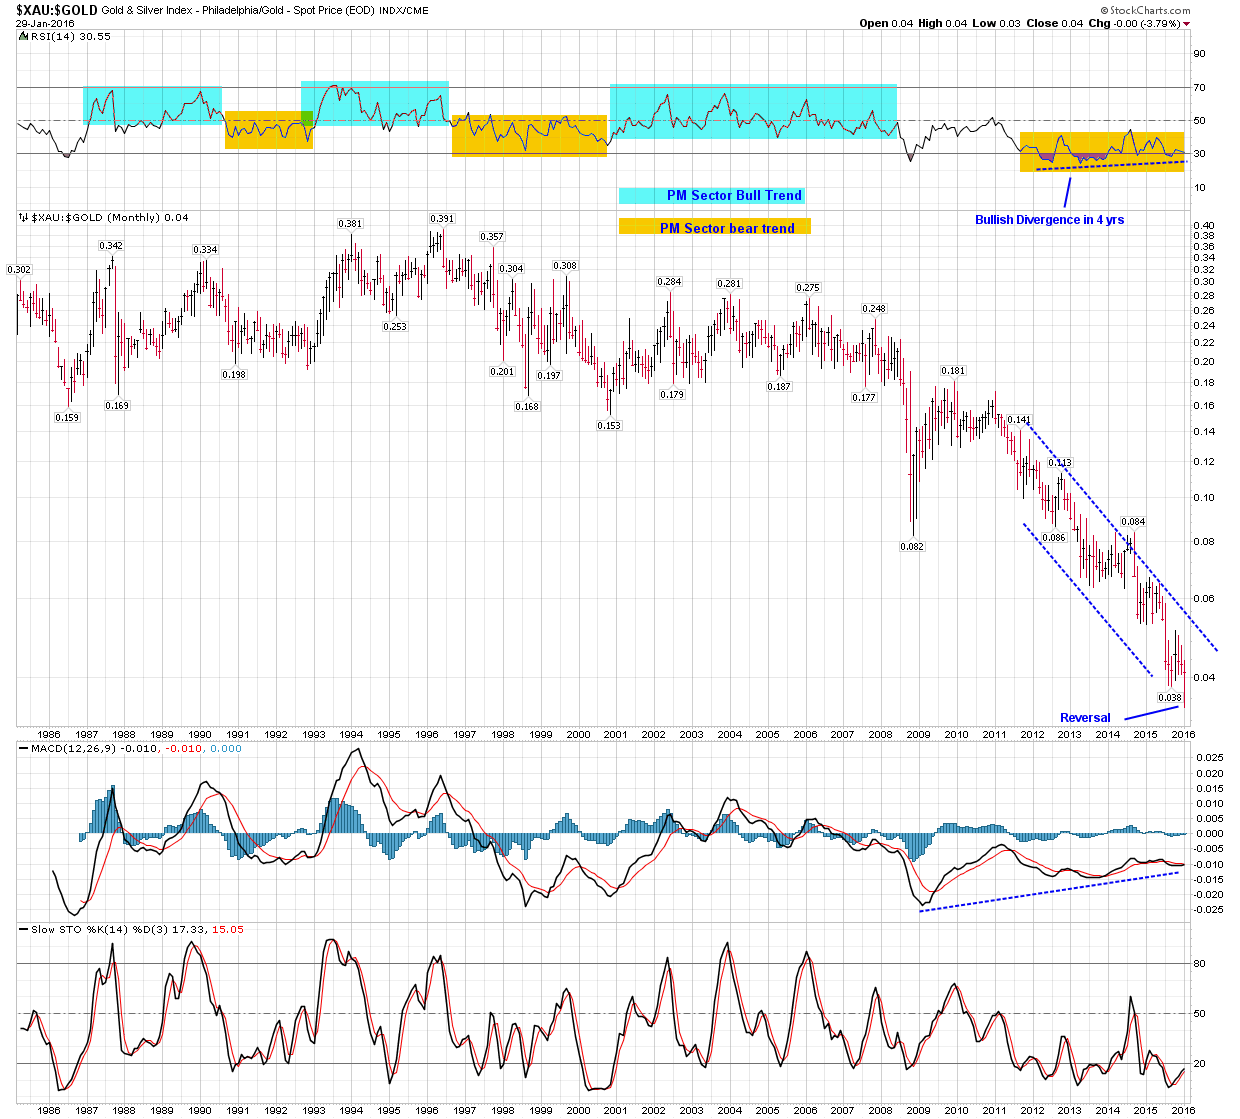
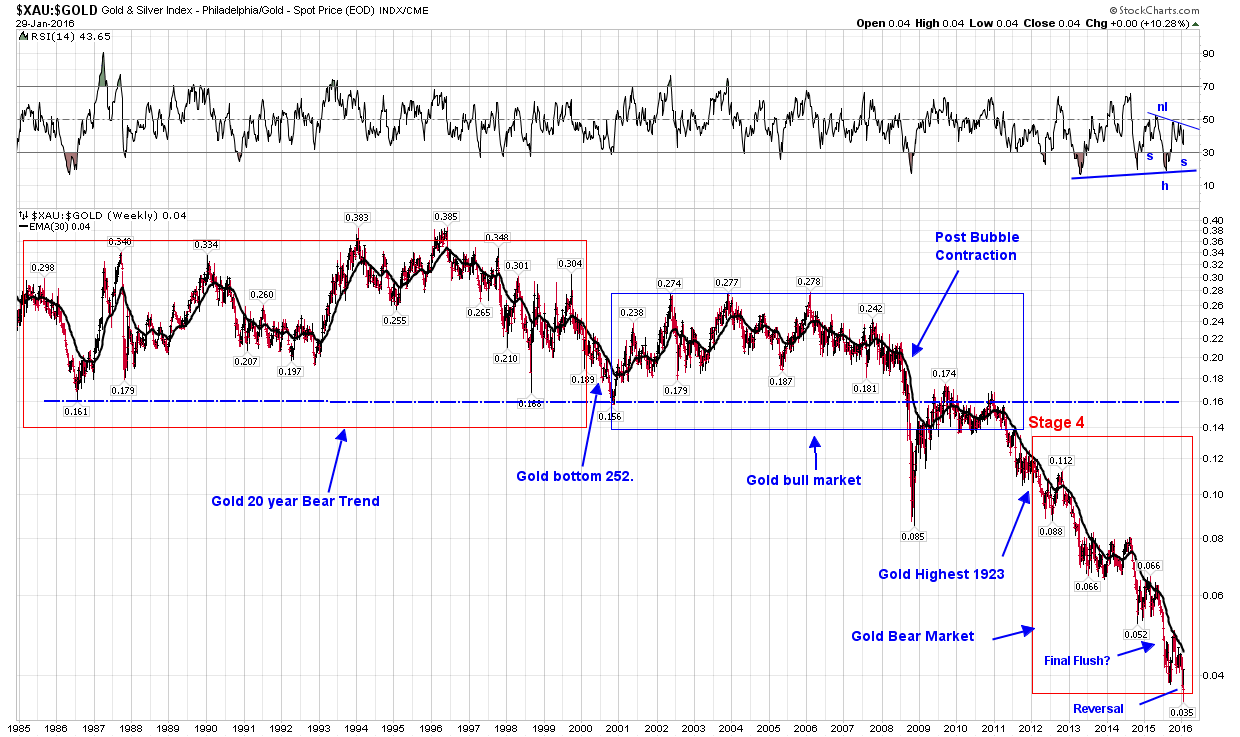
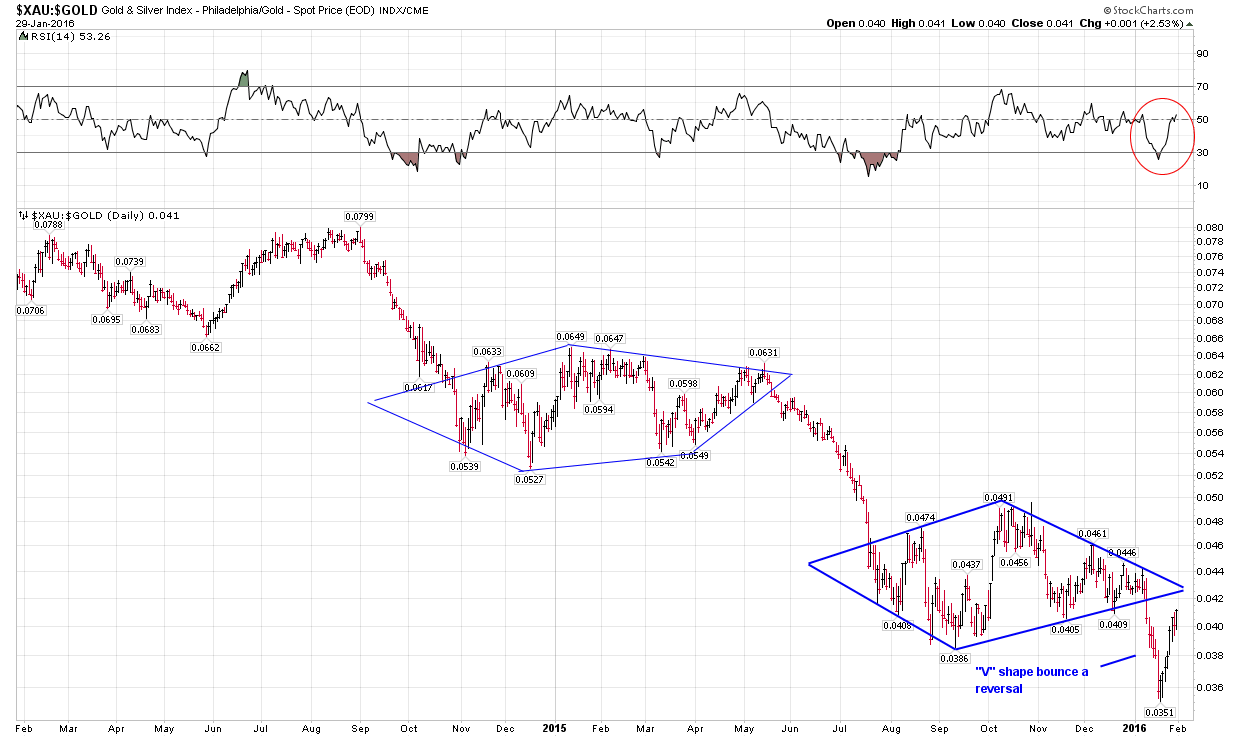
There are three period ratio charts; monthly, weekly, and daily. ALL show reversal. Reversal in this ratio leads to PM sector (miners) trend change.
Tim Ord: ” The XAU/GOLD ratio shows when gold stocks are expensive or cheap compared to gold. The speed of the rise and fall of this ratio determine by the RSI help to find bullish and bearish signals. When this ratio plunges and the MONTHLY RSI falls below 35 then a bottom is not far off and sets up the buy signals. The second part of the signal comes when the Monthly slow Stochastics of the XAU/GOLD ratio turns up from below 20. The previous six signals were all successful and four lead to over 100% gains. The two that lead to less then 100% gain came in 1998 and 1999. It is worth noting that in the last 28 years has gold stocks been this cheap compared to gold.”
Check out the RSI and Stock on monthly both meet this requirement.
Wow Bikoo
Chart on the Right is Compelling
First time the ratio has reversed and trying to backtest or consolidate near apex of diamond. Do you all great TA analysts agree????
yes, the annihilation phase has passed and that ratio chart starting in 1985 really drives that point home