A Post from the Lone Gold Bull
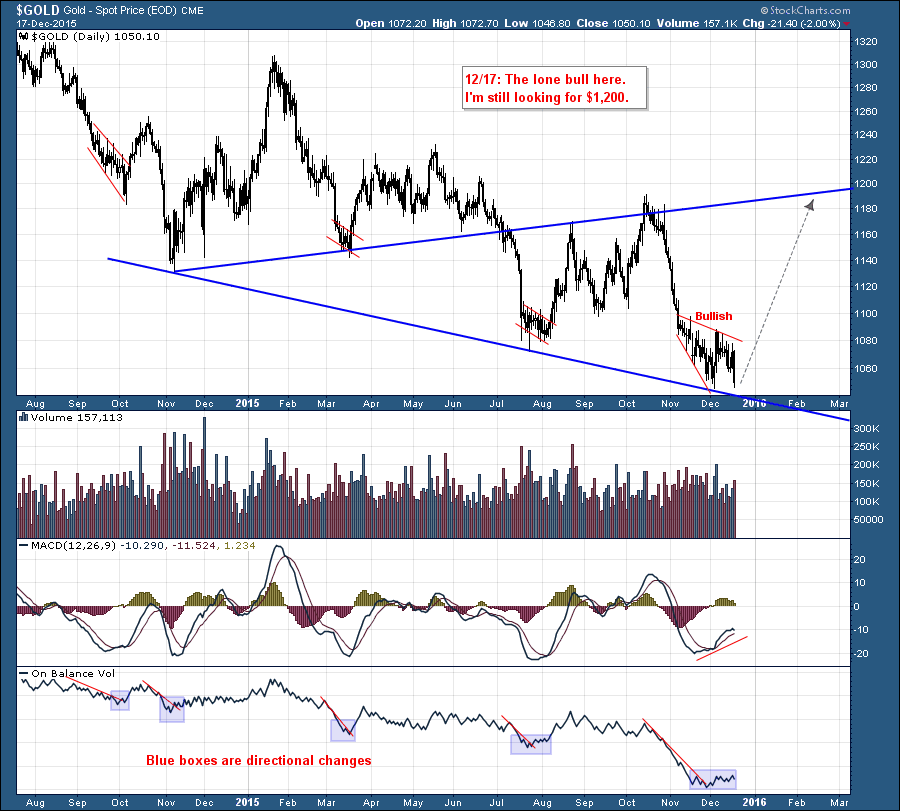
Everything about this chart says intermediate-term bullish to me with a $1,200 target, from it’s large structure and down to it’s broadening little flag underway. OBV is signaling the turn and it seems 99% of traders are looking the opposite direction. It’s a lonely opinion 😉
A little info on descending broadening wedges like the one we are in right now:

The chart above of Home Depot (HD) shows prices dropping in a descending broadening wedge. A noteworthy aspect of this chart is that there is a directional hint that the breakout would be upward when prices failed to drop back down to the downtrending support line. This “partial decline” predicts the direction of an upside breakout of a descending broadening wedge 87% of the time, according to Bulkowski’s (2005) research. I think a move in gold back above $1,060 triggers that 87% scenario.
If you are correct, the fakeout is Goldcorp in the miners. It could be the fake canary in the gold mine. To many, it is still the “leader” amongst gold miners, but if one looks under the hood, the company is unravelling and is in a tailspin south The street finally turned on GG and it has underperformed in a big way this year. They have had problems bringing Eleonore to production, they have had strikes at Cerro Negro, their operations in the Dominican have been basically halted for months due to equipment failure, their investment in Taho Resources collapsed (which was subsequently sold), and their CEO, Chuck Jeannes has just announced his departure. The company is a total nightmare. Until Newmont and Agnico Eagle break down and make new lows, the long side is still in play.
Interesting Cashcosts, very insightful info none of us would have known unless you shared. Many thanks…
“Until Newmont and Agnico Eagle break down and make new lows, the long side is still in play.”
Unlike chartologists, I don’t believe in trading off BO’s (or breakdowns as I call them). I trade off turns with the trend. We got those quite emphatically today.
So I have both NEM and AEM breaking down, after failures at the 200dma.
Along with most but not all of the sector, these are now embarking on another multi month decline, as I see it.
There’s room for a s/t bounce, but if we get that I’m seeing it as just another chance to add shorts via DUST and JDST.
Mark i hope u r right for a bounce not to 1200 but to 1100 atleast????
That will be the place the short in gold.
Mark, I think this is the most important chart of the moment. I think you will turn out to be correct.. Thanks for posting.