Something to think about
Well it’s Saturday morning time for some Quarter Backing….
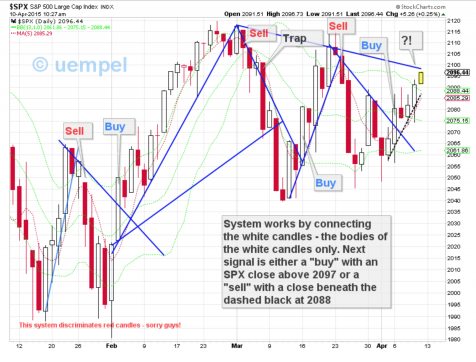
One of the guys on my day trading board posted this a while back. Simple charting technique but I have started playing with it and it does work!!! Just throwing it out there….
I’m Bearish on Gold and the Miners but my technical indicators are yelling at me… and the fact that EVERYBODY in the world is also Bearish worries me…. I think with Gold we are heading to retest the March lows but NOT in a straight line… and I’m thinking that seasonally we normally reach our lows in Gold by 4th of July… and then the EW part of me, which I’m not very good at, is telling me Double ZigZag… I trust my chart indicators.
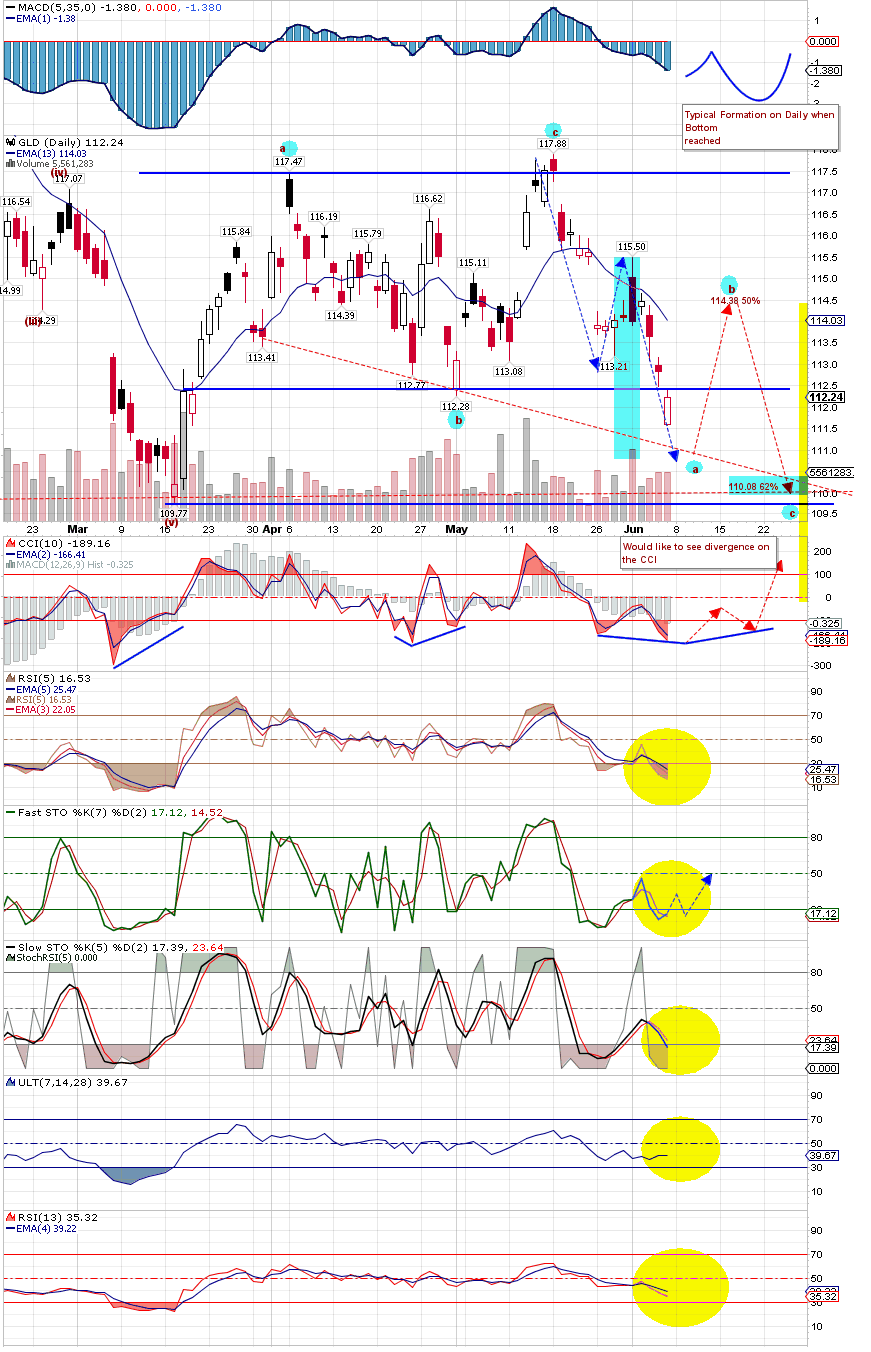
Of course if we drop straight down from here I’m not going to complain… but that little dashed red trend line I have drawn using uempel’s technique has me thinking that we have an abc in front of us before we retest THE Lows… Would also make my chart indicators happy as I have noted on the chart e.g., more well defined EWO formation, divergence on the CCI, need to see more of an abc formation form on the FastSTO….. Its funny but that 110 target sits at the 62% retrace mark of a 100% measured move for the abc formation WHICH IS VERY CLOSE to the previous low and is RIGHT ON the Red Dotted line connecting the two previous lows….. hmmmm….. My rebound target of 114.38 is a little higher, assuming a 50% correction, than my EW estimate of 113.47 given earlier but it does give us a range using two different modeling techniques of what we might expect…
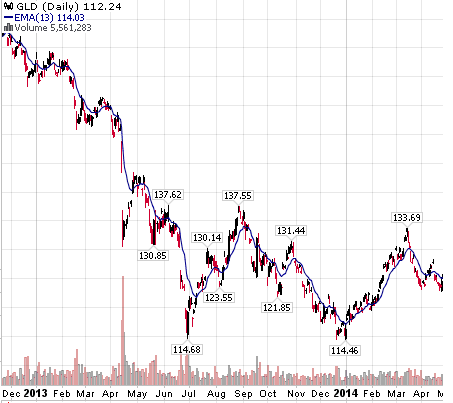
Now if you go back two years and look at the GLD Daily Chart for 2013, you see us reaching a low end of June first of July then up through the middle of August then DOWN till the end of the year… Notice the abc spike up middle of October (I’m thinking Armstrong ECM End of The World Spike coming 15 October)…. Fractals, cycles, yes I believe in that stuff…… Bo would be proud!!!
Did I see a spinning top candle on daily GDX on Friday? This can denote a trend change…