Gold Fractals…
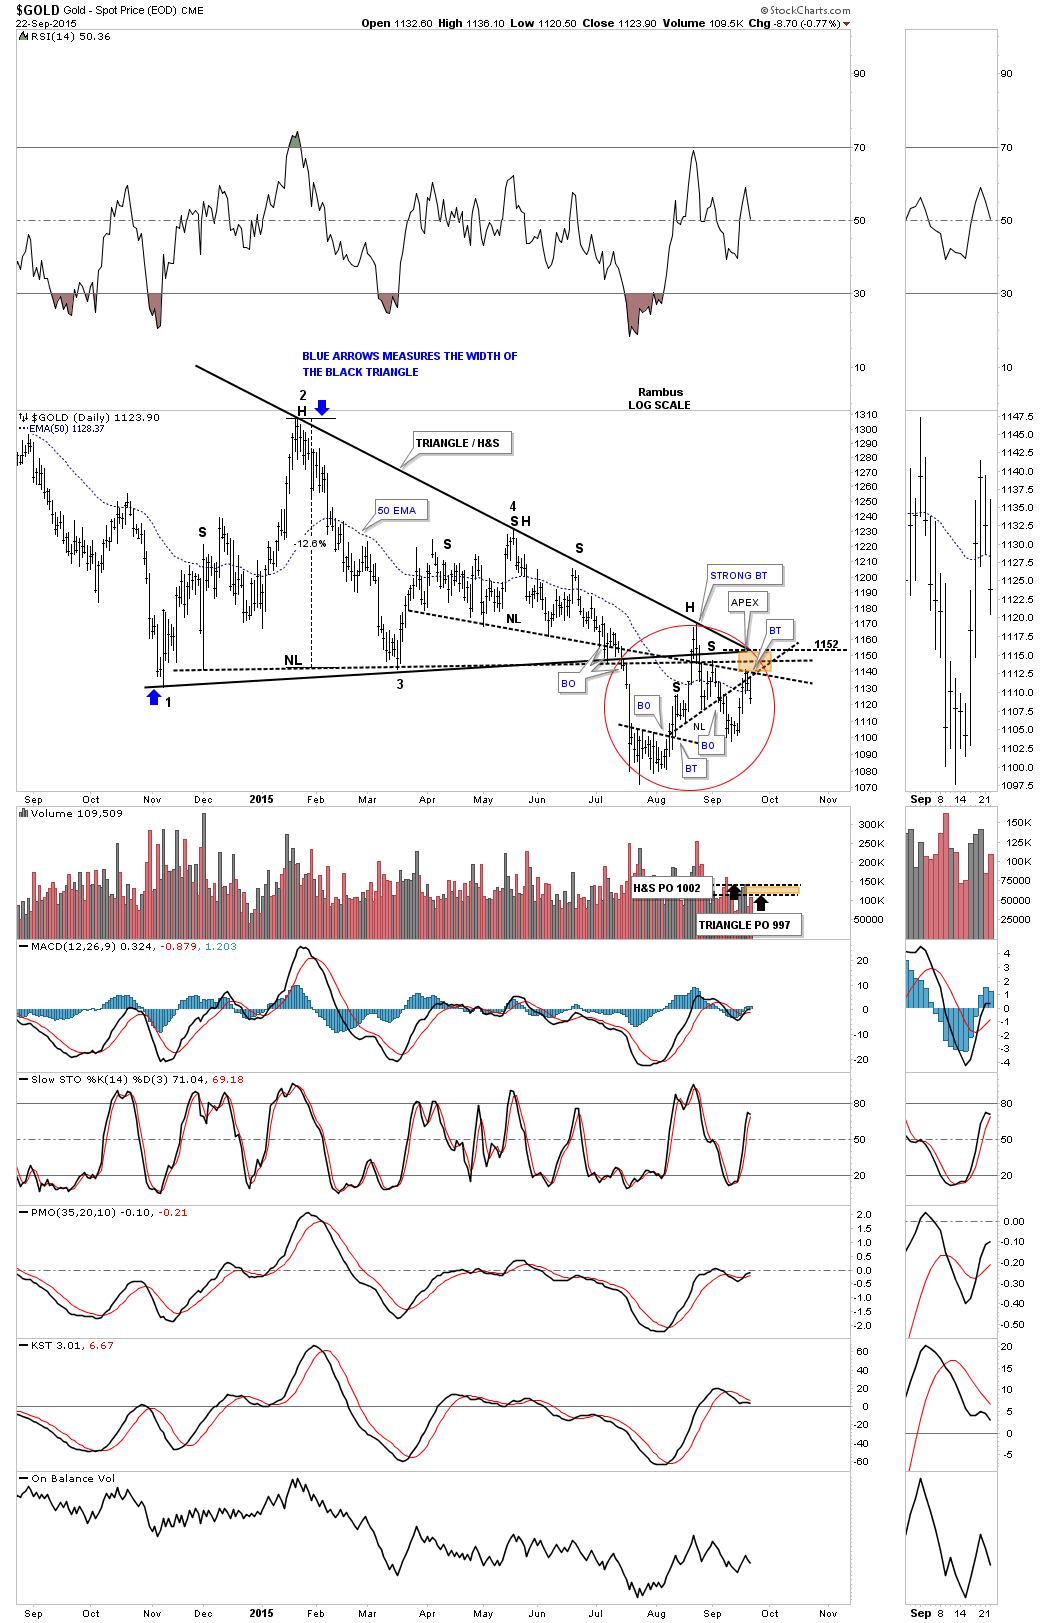
Sir Fullgoldcrown asked me if I would post a few charts here on our sister site until the main Rambus site gets back up and running again. From the November low last year the precious metals stock indexes and gold carved out similar consolidation patterns. This was a combo consolidation pattern that consisted of a triangle and H&S consolidation pattern as shown on the chart below. The bottom rail of the black triangle and the neckline were both broken to the downside in July of this year. From the breakout the anticipated decline began which was fulfilled on the PM stock indexes but gold refused to follow the miners to new lows. This daily chart for Gold looks a little busy so I put a red circle around the area I would like to focus in on. After the breakout from the bottom rail of the black triangle and the neckline gold started the backtesting process, which initially was on the strong side, as it took the top rail of the black triangle to finally hold resistance. Note the confluence of trendlines and necklines that all intersect in the brown shaded rectangle at the 1152 area. The smaller H&S pattern that has formed just below the much bigger triangle / H&S consolidation patterns, backtested its neckline this week.
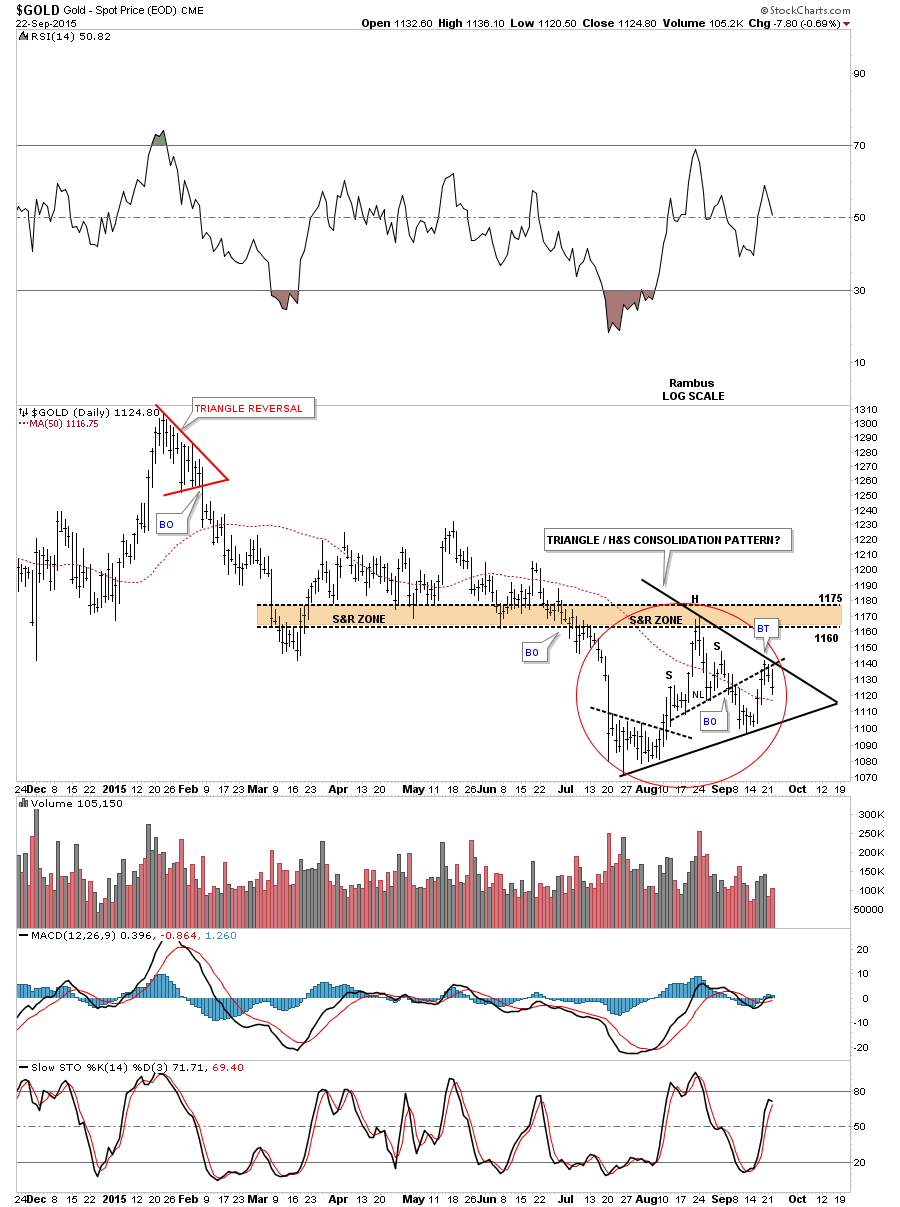
Below is a shorter term daily chart for gold which shows the price action below the bottom rail of the black triangle and the neckline of the H&S consolidation pattern that we looked at on the chart above, red circle. I’m viewing the price action on the chart below as a fractal to the longer term daily chart above. As you can see there is a H&S forming inside the blue triangle which won’t be complete until the bottom rail is broken to the downside so there is still a little work to be done yet to complete the fractal.
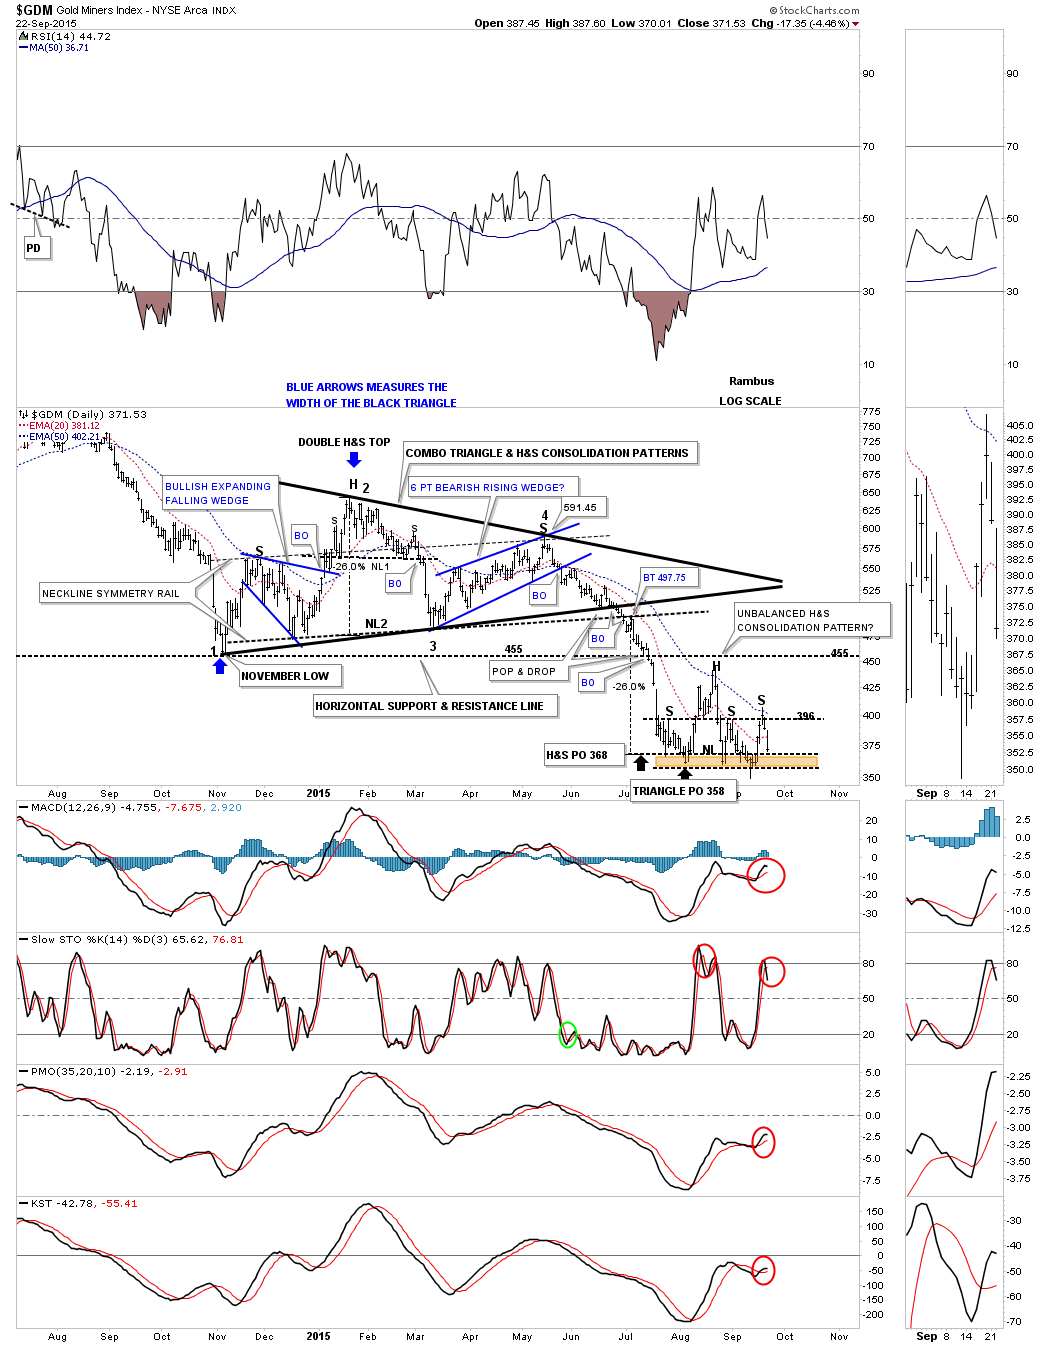
Below is a daily chart for the GDM which shows its combo triangle / H&S consolidation patterns. The brown shaded area at the bottom of the chart shows the price objectives for the triangle and the H&S consolidation patterns which were met, black arrows. It looked like last week the smaller H&S pattern, that formed off of the price objectives, was getting ready to break the brown shaded S&R zone or in this case the neckline but it threw us one more curve ball by rallying back up to the height of the left and right shoulders giving us an unbalanced H&S pattern at this time. Again keep in mind the H&S pattern won’t be complete until the neckline is clearly broken to the downside. The big triangle / H&S pattern looks very busy but it has some nice symmetry. The left and right shoulders were made from highs from the individual blue consolidation patterns while the head was made up of a small H&S top labeled NL1. The neckline symmetry rail, which is just a parallel line taken from the neckline and added to the top of the left shoulder, showed us the height for the right shoulder. When comparing this daily chart for the GDM to the gold chart above it’s very clear that the PM stocks are still under performing gold in a big way which has been the case for most of the four year bear market. All the best…Rambus
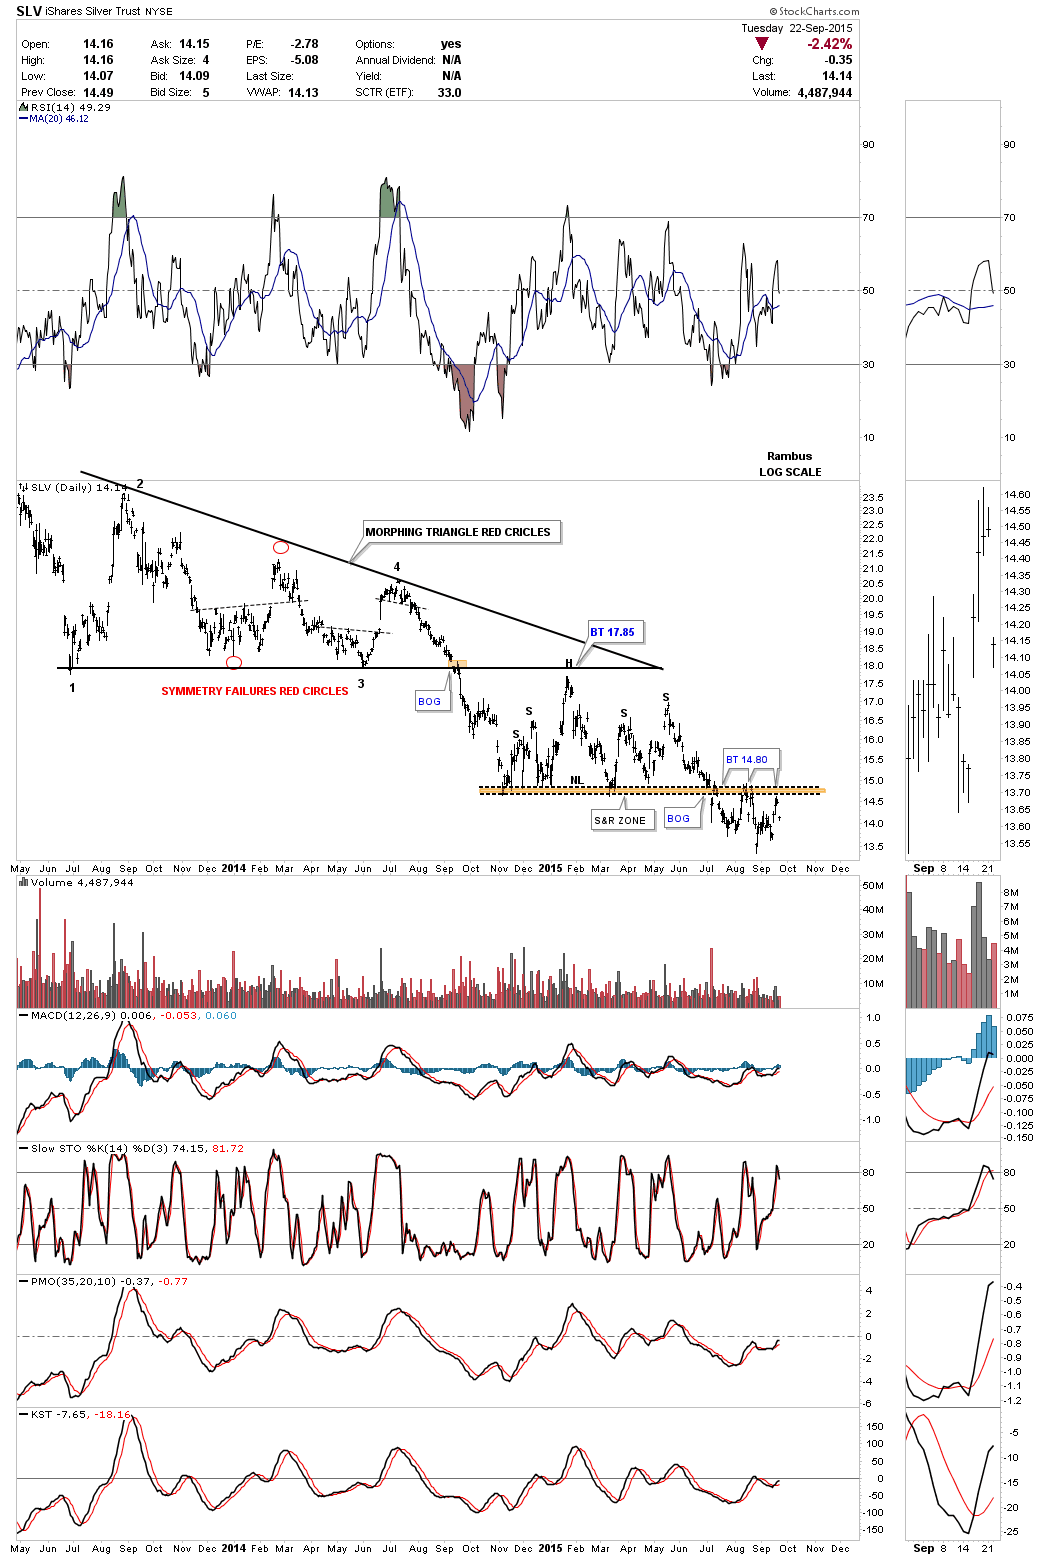
PS: Just a couple of SLV charts. This long term daily chart shows the H&S consolidation pattern that broke down back in July of this year and has had three backtests to the brown shaded S&R zone or neckline at 14.80.
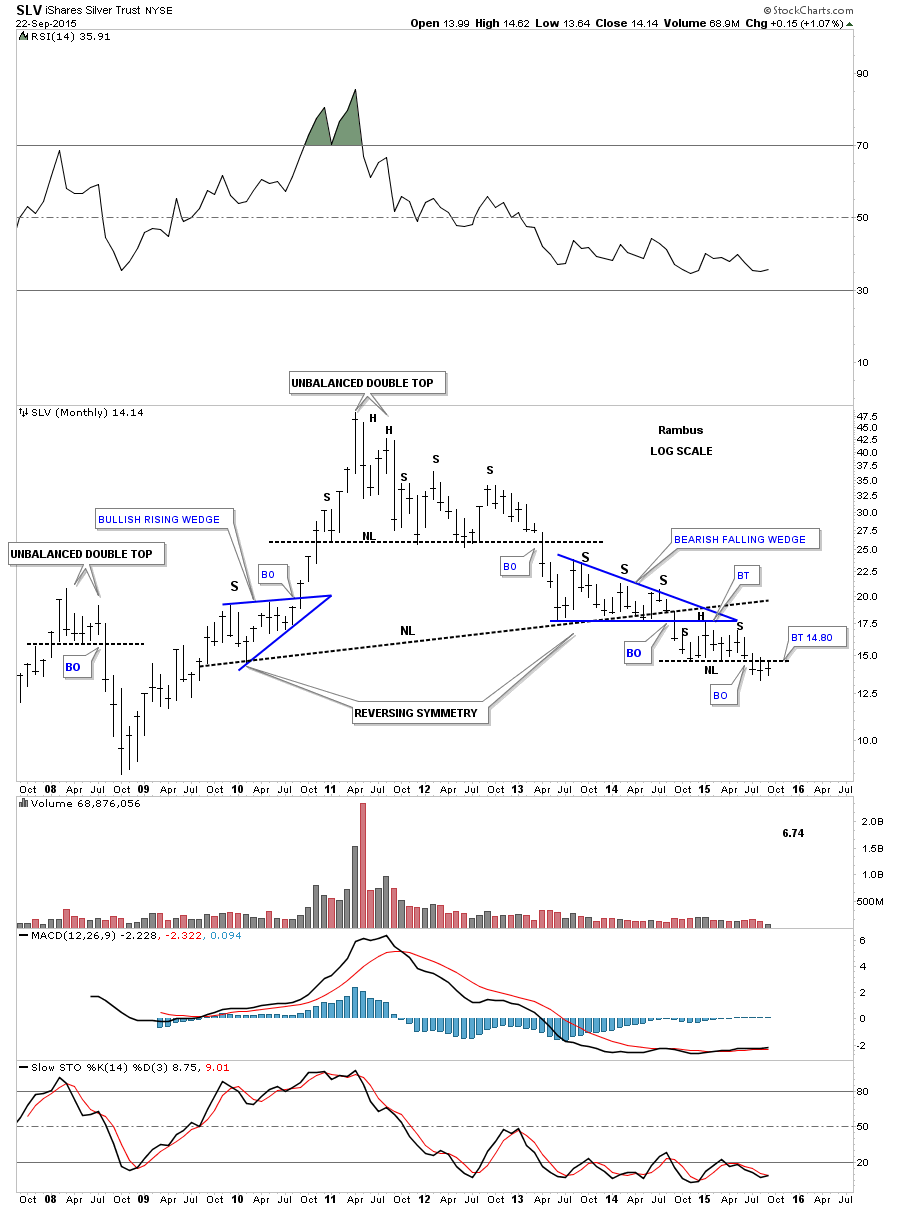
The monthly chart for SLV shows just how important the smaller H&S consolidation pattern, on the daily chart above, is to the overall big picture. This chart also shows you how hard it has been to try and trade the small counter trend rallies that only last one to 2 months or so. In order to be halfway successful one needs to catch the exact bottom and sell the exact top to make it worthwhile.
Thanks a lot, great work