Gold Down 20 Silver Down 40
Have we been HAD again ?
We were due a correction…but this is viscious
We have a new poster at The Chartology Forum who has just presented a case that this was just another
Bear Market Rally
Winelover (from France) seems an experienced Chartist and says we have seen these false breakouts before..it is the norm in his opinion
Here is an excerpt of Part of his Post
………………………………
This post will be a little bit long, but instructive. I didn’t write since one week, but since my vacation are finished, I didn’t have time. A lot of things are happening this week that favors the bull. We got the break of the 2014-2015 trend line, a big jump over the 50 and 200 days moving average and a big positive reaction of the mining stock. This is what you want to see in a bull market.
If we take a look at the other side of the story, I see a lot of things that tell me this rally is probably just another convincing Bull trap rally.
Before going to the charts, I will tell you again, It could be with the monthly or the quarterly chart, my cyclical long term model tell me the bear is not finished. If this time is different, it will the first time in 45 years this model is wrong. It’s possible, but unlikely.
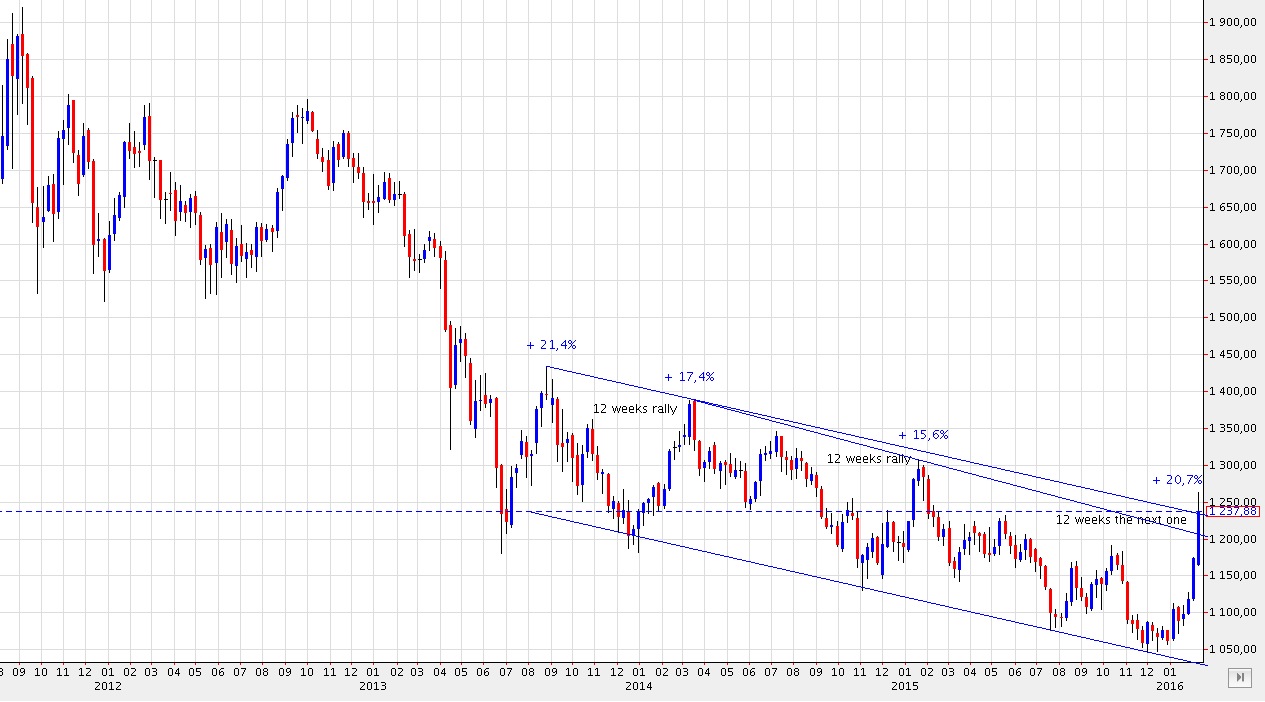
The first thing I want to show you is the next chart that suggests that until this week, this rally is almost like the others one before, even if it’s a little bit stronger. The 3 intermediate BEAR rally that we got since 2013 was between 15% and 21%. The present rally got 20,7% by now. If we follow the duration of the rally, it should stop the next week for a 12 week rally.
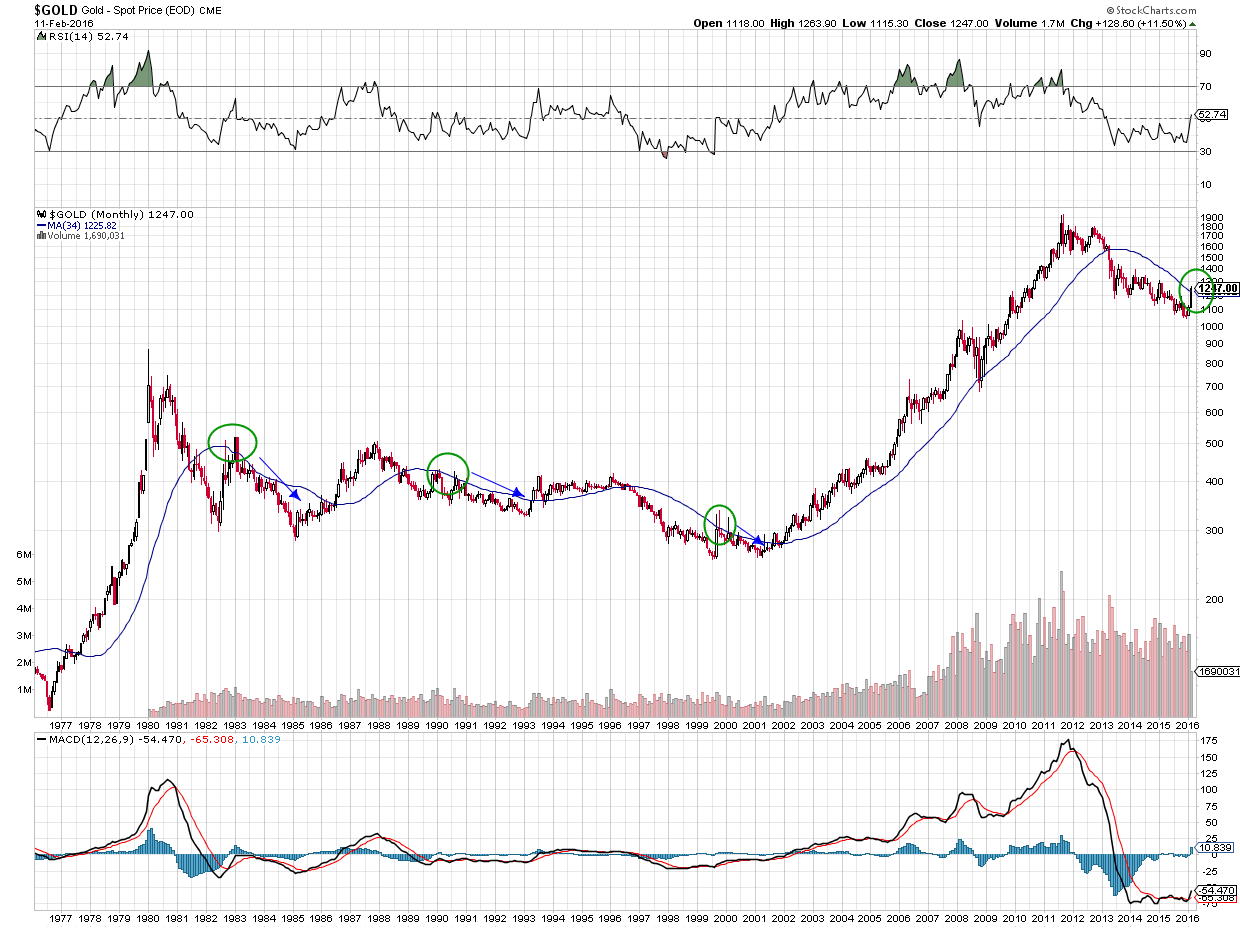
You have to realise in a BEAR market that GOLD got always, without exception, one big reaction that test the 34 month average. This reaction tells us that GOLD become in life slowly. Every time GOLD touch this average during a bear market, it went down after for some months to finish the BEAR.
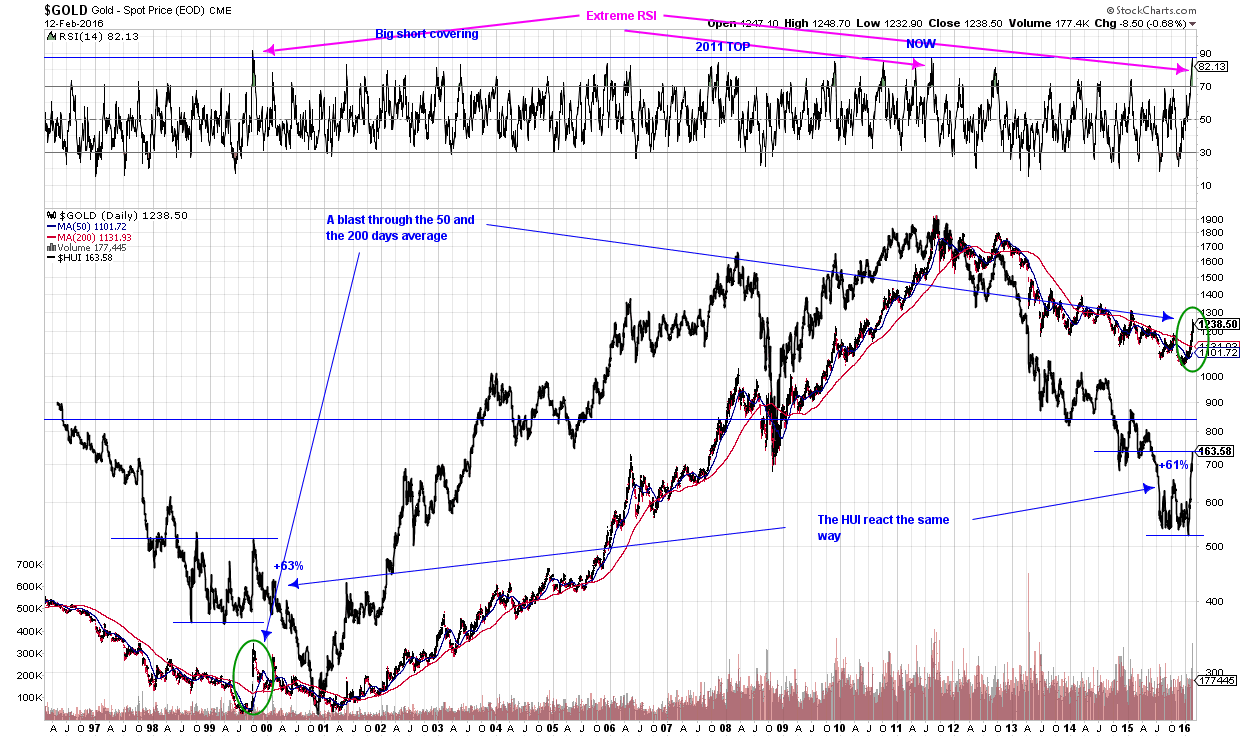
If you compare the last time this event took place in 2000-2001 to now, we can see a nice symmetry between them. On the daily chart, you can see the extreme RSI touch only 3 times in 20 years. The first one was during the convincing big bear trap rally in 1999. The other one went at the end of the bull rally in 2011 and the last one is now. We got also a pretty nice reaction of the mining stocks. They did about the same rally (60%) before to going down again. Just before the rally, take a look in the pretty nice positive divergence between GOLD and the HUI. GOLD touch a new low during May-June 1999. During the same time, the HUI did not. It made a higher low. Exactly what the BULL wants to see to declare the end of the BEAR. After this rally, HUI got killed again with GOLD. Right now, we have exactly the same behavior. GOLD touch a new low in November-December 2015. HUI did not. It just retest his last low. After scary every bull by touching quickly a new low, it reverses and explode with GOLD. That’s where we are now. If this relation continues, we will see shortly GOLD and the HUI reverse again.
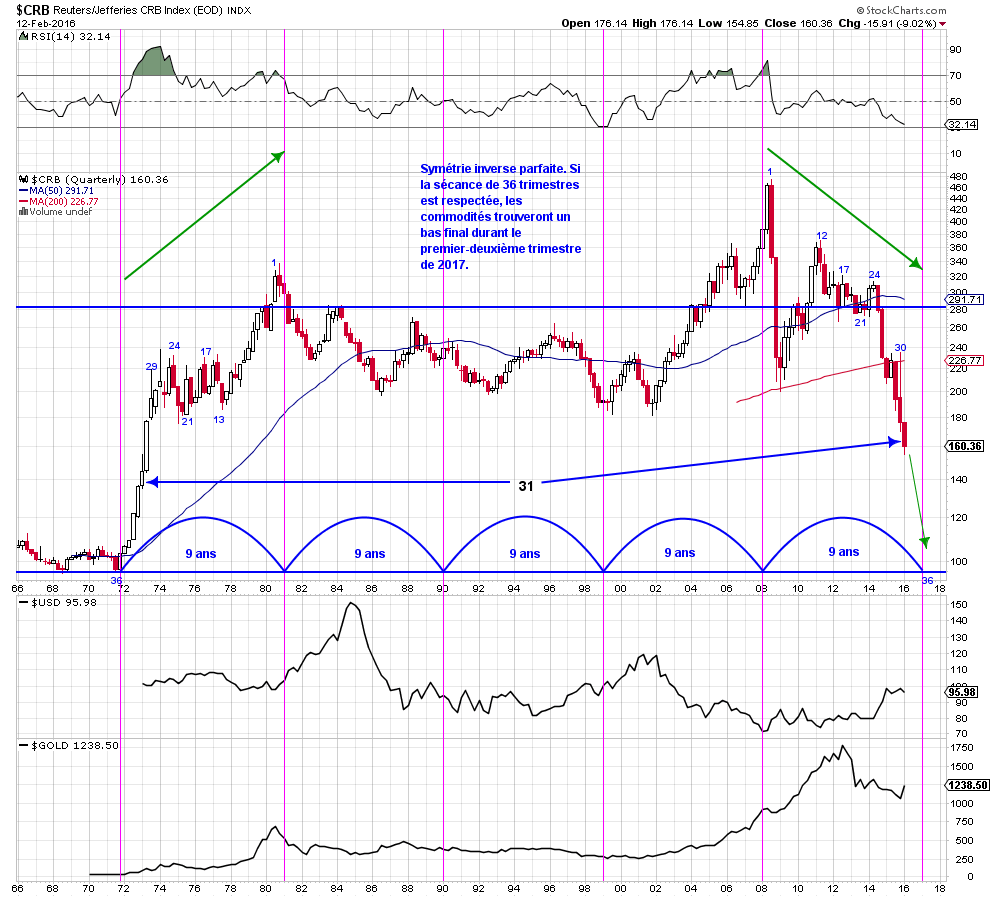
Finally, when I take a look at my cyclical commodity chart, even if I try to convince myself that the new BULL in GOLD had started and that the deflation implosion is maybe finish, it’s something I just can’t do. Maybe the next weeks will do the job and change my mind, but until today, I stay a BEAR.
………………..
Fully’s Comments
Winelover is a PartyPooper
But he does make a plausible case here
Sheesh
This is essentially what Armstrong was saying.
Gold was in a secular BEAR from 1979/80 until 2001 so the first 3 times that gold touched the 34dma were during gold’s secular bear…then in 2001 Gold’s secular BULL market started and ran from 2001 to 2011 at which point gold entered a cyclical BEAR within its secular BULL so the last time gold touched it’s 34dma is NOW as gold exits its cyclical bear to resume its secular bull ….what I see on that chart is saying Gold is resuming its Secular Bull market that started in 2001….I’m basing that on Adam Hamiltong’s paradigm that secular bulls and bears last approximately 17 years each so gold’s secular bull has several more years to run…gold’s secular bull should run to 2018 as it started in 2001…but we won’t have long to wait to see if gold’s move now rises above/stays above that 34dma–
Probably I’m wrong but the last secular bull market in gold lasted from about 1968 to 1980….it lasted 12 years.
Well Adam Hamilton’s graph of the Dow’s bull and bear markets shows the Dow’s secular bear running from 1966 to 1982 and IF the PM secular bull did run at the same time that the Dow’s secular bear was running then 1966-1982 would be the time frame which is 16.5 years but I’m going to dig into this…I know that the gold price was fixed at $35.00 an ounce before 1971—so those 5 years from 1966 to 1971 when the gold price was fixed have to be considered…how did the Pm miners do over that 1966 to 1971 time frame? I don’t know but if their secular bull was 1966 to 1982 the same time as the Dow’s secular bear was running that would be interesting to find out
But as you pointed out yesterday parabolic moves are unstable so seeing some retrenchment now (to test the breakout maybe) seems right on course
Gold down almost 30 now….
I found proof that Winelover is correct in his analysis: https://m.youtube.com/watch?v=sa5MF91gU4g
Puke
Yup, that about seals it right there, doing exactly 100% opposite what Blo Pony spews out of his mouth will put you on the right side of the trade.
Gold -32.00
Silver -48c
Winelover! Wow, you know I have been looking at the gold chart and wondering if this upmove is like the 1999 spike in gold (on the Central Bank Washington Gold Agreement). This current gold spike was on the Yellen trip over on her own BS meeting.
After 1999, it took a 1 to 2 year decline to test the 1999 lows near $253 and actually they held and made a higher low near $255 and then the bull market began with a big bowl formation breaking out.
Interestingly, Tim Wood (Cyclesman) has a 10-12 month ‘annual’ cycle for gold, making about 9 cycles in just over 8 years in his 9 year cycle as he calls it. That would allow for some variation. He still sees one more down-cycle in gold by the way before the bear market ends. That would fit in nicely with Winelover’s chart of temporarily failed breakouts, the second one on the above summary.
The third chart with the HUI on it: Winelover says: “The HUI react the same way”, ie up sharply on the 1999 and 2016rallies.
Now take a look at what happened to the HUI afterwards into 2001! Down we go?
The third chart with the HUI on it: Winelover says: “The HUI react the same way”, ie up sharply on the 1999 and 2016rallies.
Now take a look at what happened to the HUI afterwards into 2001! About -55% from top to bottom. Down we go?
That’s why I posted this dave…that is what he is saying
I realize I’m late to this party but this posting is what prompted me to request access to the site…..
1) Winelovers’ last graph I believe should be inflation adjusted in $’s to more accurately depict ‘where gold is and how low it could get’.
2) I don’t believe we should ignore the recent oil/gold ratio high (47), which historically when it is at very high levels (over 20) which of the two commodities most commonly corrects to revert to the mean (16) – answer > oil. Personally I cannot see a scenario where <$30 oil is more sustainable in the world than gold first crashing to $500 – i.e. due to global mkt forces (including wars or CB policy to force inflation or devalue the $) – oil will rebound before gold gets cut in half.
3) Winelovers’ 3rd chart TA comparison of 98-00 vs. now does not (nor was intended to of course) consider all the world events and market forces that were in place in ’98-’00 (market was relatively euphoric and US economy stable after resolution of LTCM debacle) vs. now where the entire stock market rise for the past 6 years has been built on central bank engineering of a magnitude not seen since the great depression. 16 years ago CNBC wasn’t talking about NIRP, banning the $100 bill and the fact that the US public is gradually becoming aware that the Fed and central banks in general in fact have no clothes and currency value = faith (fiat). If the #3 world economy in Japan can go NIRP, why can’t the US? There are very big world value-of-money and power issues in play that didnt' exist in the late 90's.
These non-TA reasons in addition to Spock’s (FGC’s) already documented thesis' are why I think a small pullback ‘may’ come but it’s just as likely gold won’t look back at these levels for a very long time.