Talk of a Tradable Bottom?
I’m reading all these posts about a tradable bottom here but frankly I don’t see any chart evidence at all for that. Perhaps we’ll see evidence as we move into MA’s benchmark targets around Dec 7th but charts are all pointing to a collapse of the GDX consolidation that has occurred the past couple of weeks…at least to my eyes.
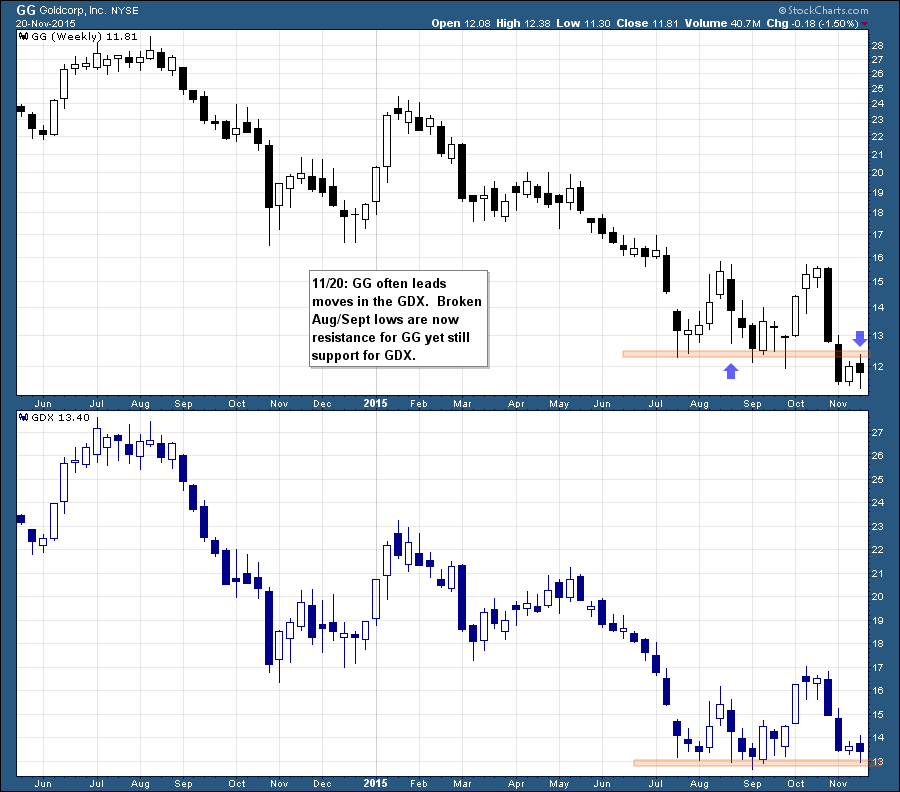
In the school of “GG leads”, I believe it’s tipping the GDX’s hand of what’s to come….more down and current support morphing to resistance.
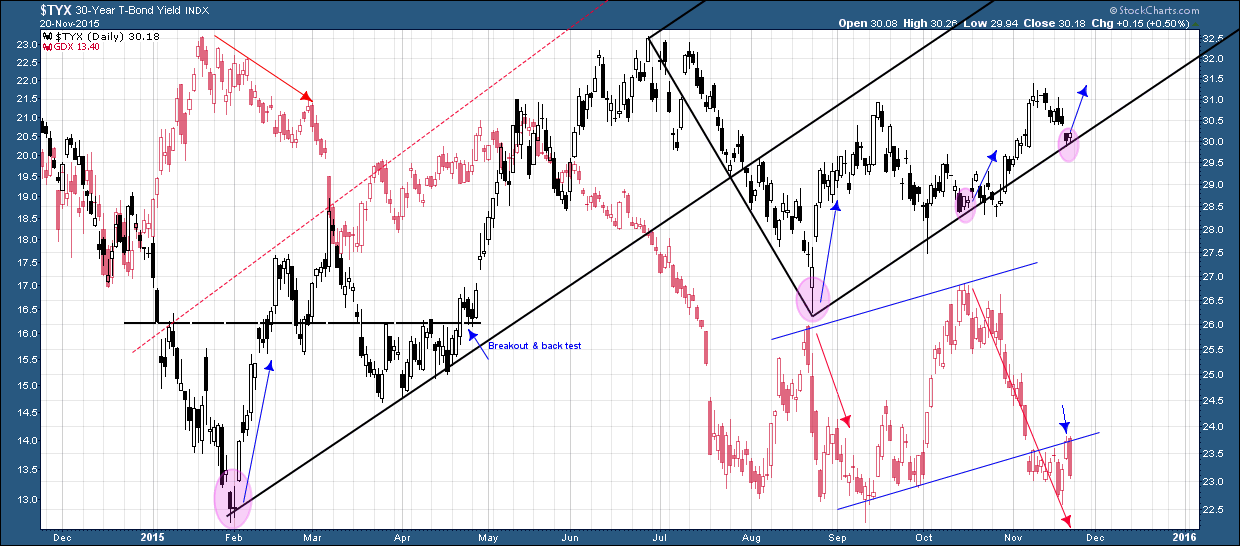
Meanwhile, I last shared on Oct 12th my chart that tracks a nice fork fit with the 30-year yield against the GDX. It pretty much nailed the last GDX swing high and again it’s suggesting a big move down in GDX any time now as yields are poised to rise. I think that move started Friday actually as options expiry briefly bumped GDX to $14 and then whammo.
With the backdrop of the SM being at what I believe to heavy resistance levels, the GDX should have quite a bit of difficulty rising from here. We’ll see how the charts develop next week.
Love the GG Leads Theory Mark
Have seen this with my own eyes
I am in agreement with you 100%
Keeping all options open …but a bottom here seems unreasonable
Thanks for your continued posting Mark. You and Plunger are the two best out there even though you two are on opposite sides for the time being. Even still, I’m not sure P believes a move much higher much less a true bottom is a slam dunk from here. Just possibilities. Thanks again to you both. “Nobody does it better…” than you two:)
I see a possible W bottom formation (inverse H&S) on daily GDX – left shoulder and right shoulder line up perfectly 🙂