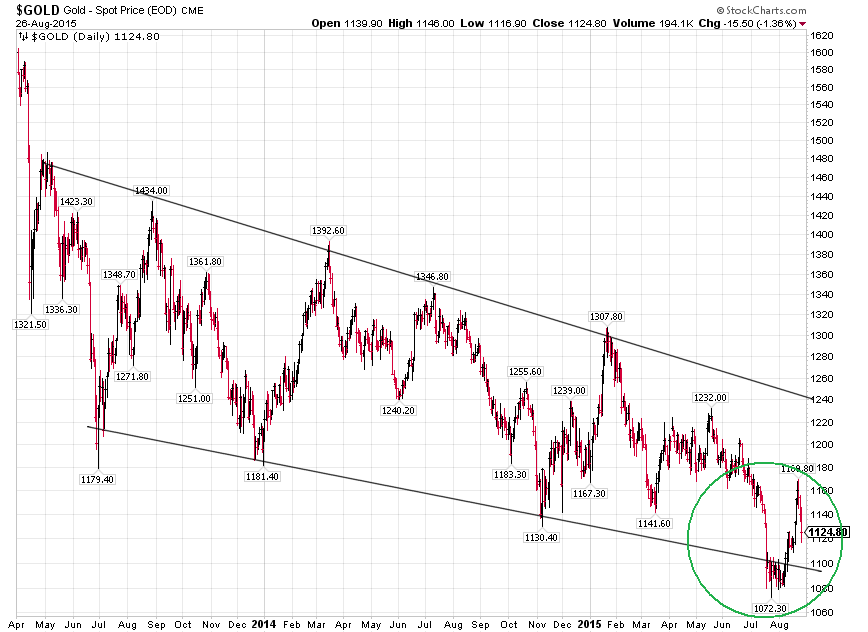
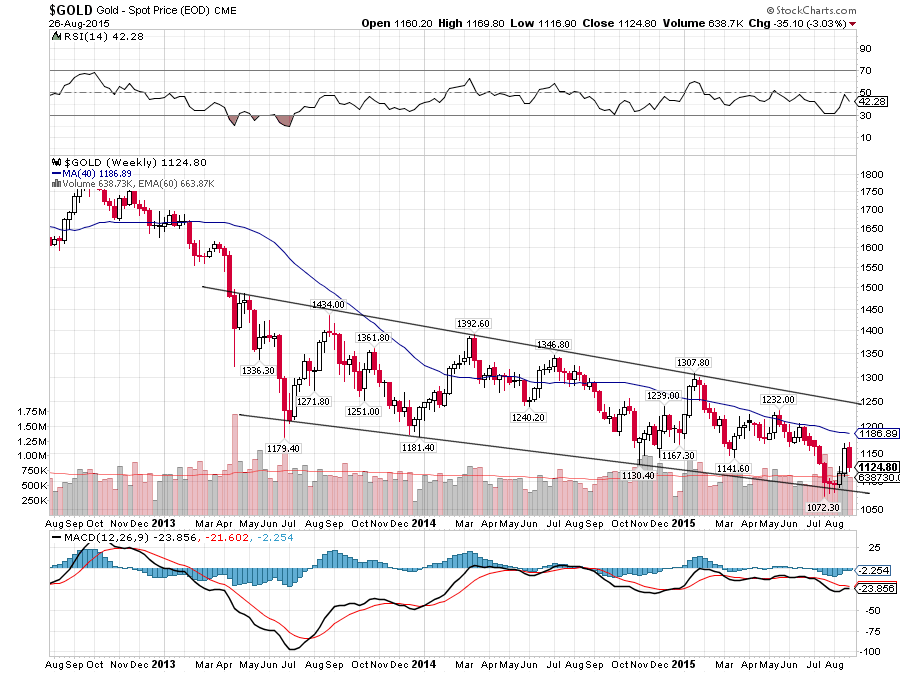
Gold is looking a lot like the Yen last year.
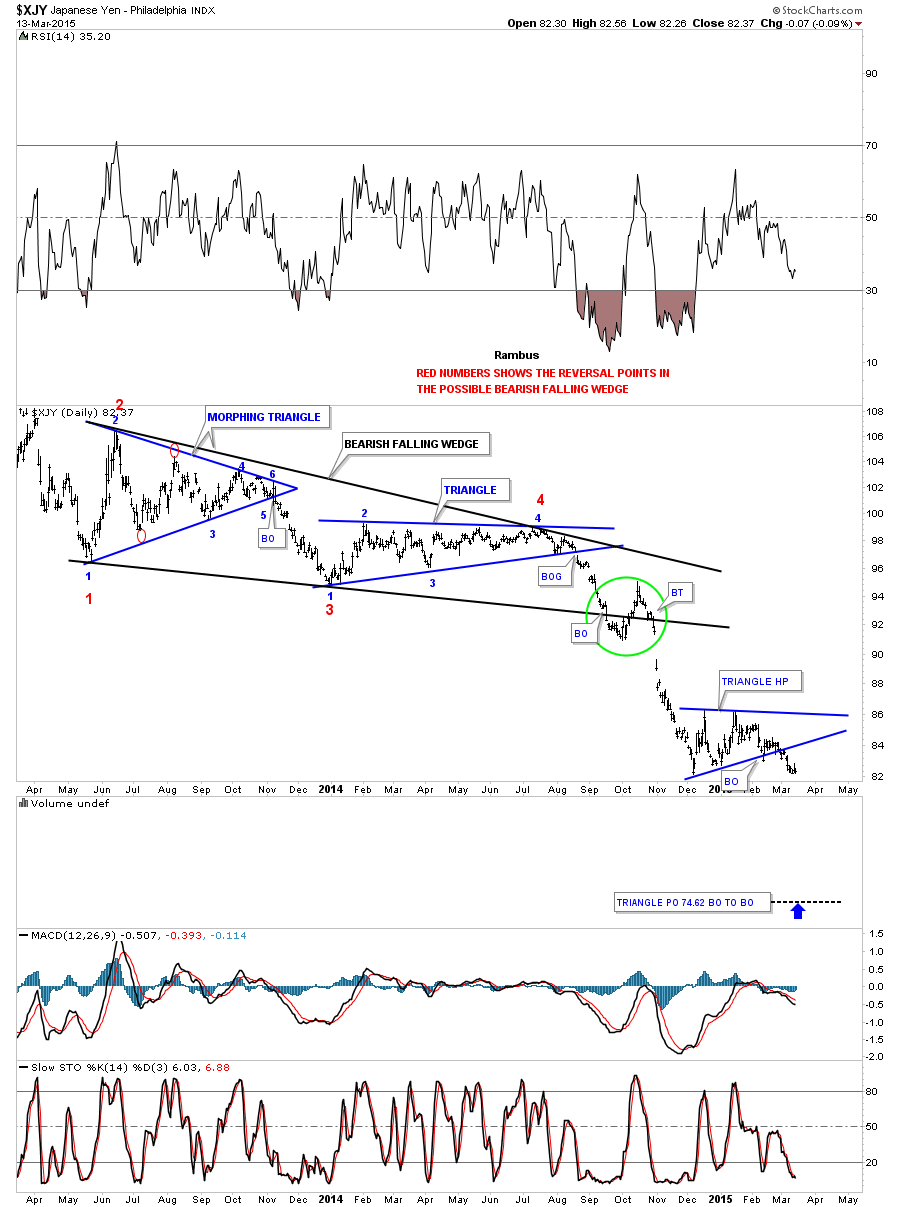
Here is the Rambus chart for the Yen that seems to fit in with the Plunger’s theories on where we have been in the gold market, perhaps coming into phase III of the bear market.
http://rambus1.com/wp-content/uploads/2015/03/xjy-day1.png
As I understand it,the green circle is the transition from phase ii (consolidation) to phase iii.
If you look at what gold is doing right now, it is in the equivalent of the green circle (action in the Japanese yen from September 2014), just coming off the high that topped out about halfway up its trading channel. Uncannily similar in my naive view!
Of course, it depends where you draw the lower line of the consolidation but as with the Yen gold is tending to accelerate to the downside gradually during its consolidation and then fall through the bottom of the channel. I have tried an OHC daily chart and a weekly chart but it is a lottery.
Is Phase III for gold about to begin?
I am going to ‘quote’ the Rambus Yen chart below. Any objections and I can remove it if needed!
Nice evaluation there Dave.
Excellent. Thanks for the post.
Sure does look eerily Similar Dave
Thanks Dave, excellent post