Well Nadia thinks the Dollar is going up (From FREE Newsletter)
Forex Trading Alert originally sent to subscribers on June 9, 2015, 8:19 AM.
Although EUR/USD moved sharply lower yesterday, the exchange rate reversed and erased some of earlier gains as uncertainty over Greek debt negotiations weighed on investors’ sentiment. Will we see further deterioration in the coming days?
In our opinion the following forex trading positions are justified – summary:
- EUR/USD: Short positions (stop-loss order at 1.1667)
- GBP/USD: Short positions (stop-loss order at 1.5913)
- USD/JPY: none
- USD/CAD: Long positions (stop-loss order at 1.1706)
- USD/CHF: none
- AUD/USD: Short positions (stop-loss order at 0.8194)
EUR/USD
The situation in the medium term hasn’t changed much as EUR/USD is still trading around the 23.6% Fibonacci retracement. Today, we’ll focus on the very short-term changes and find out what can we infer from the daily chart.
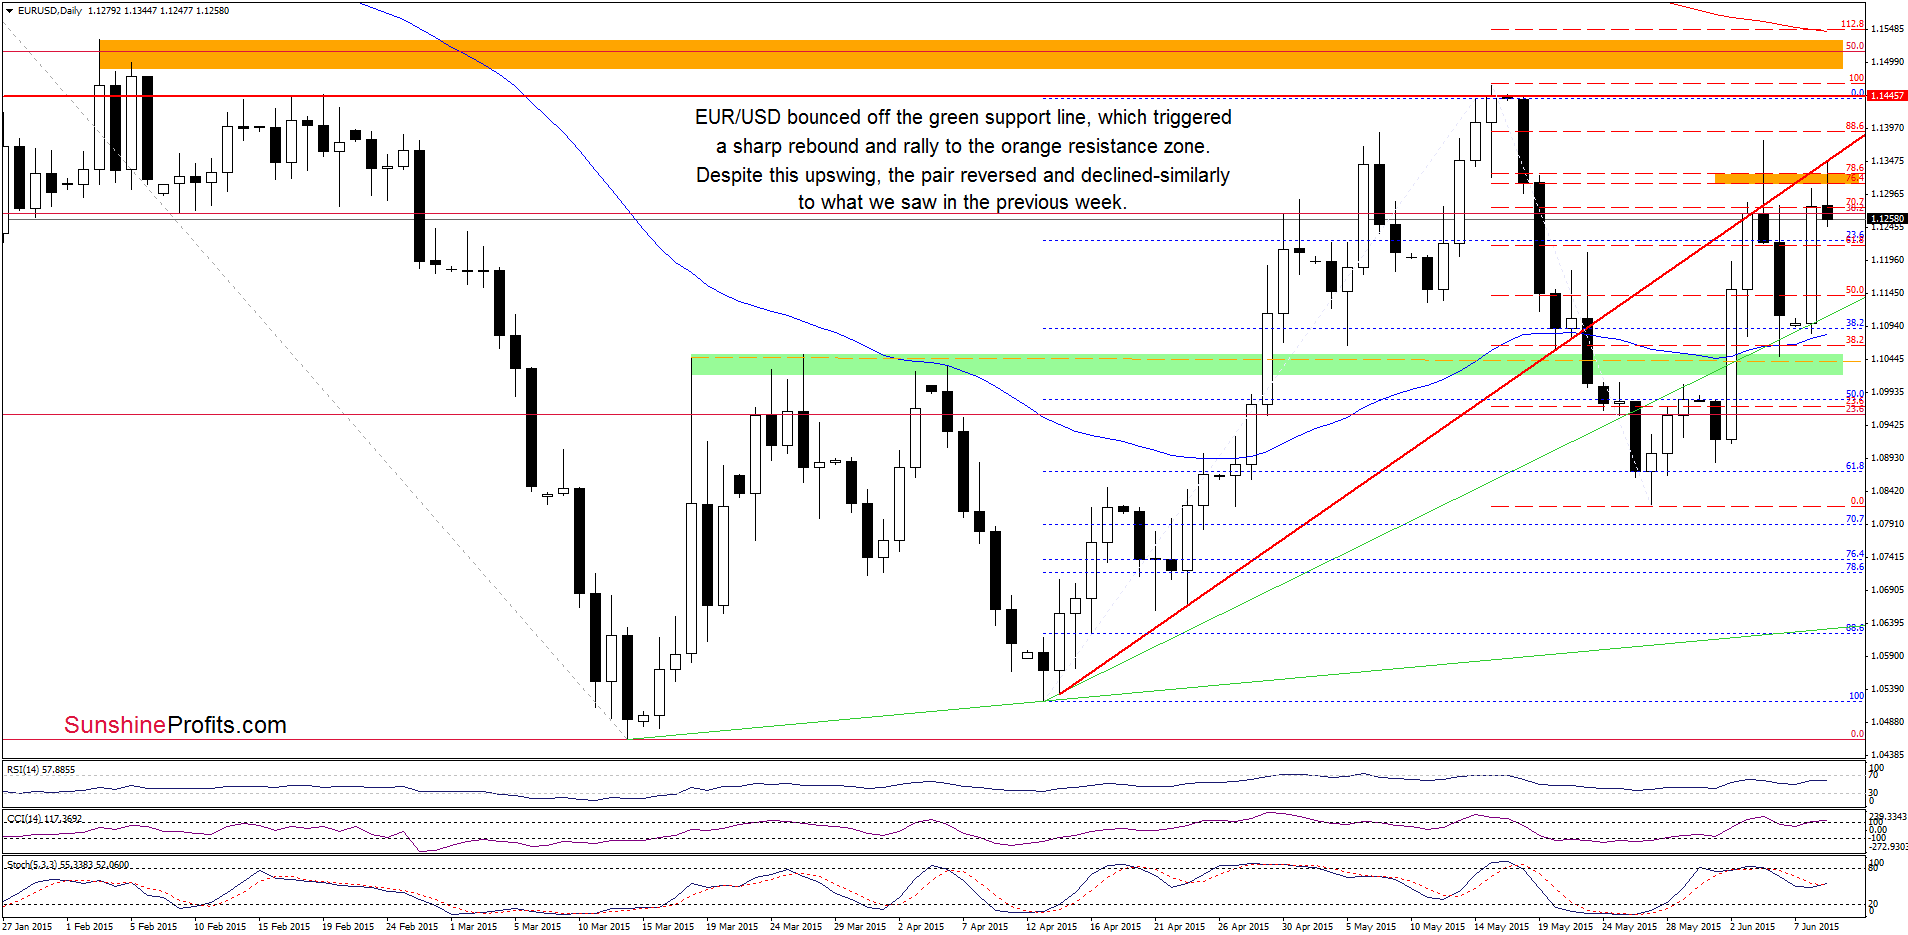
Looking at the daily chart, we see that the green support zone triggered a sharp rebound, which took EUR/USD to the orange resistance zone created by the 76.4% and 78.6% Fibonacci retracement levels and the short-term red resistance line. In the previous week, this area was strong enough to stop further rally. As you see on the above chart, the history repeated itself and EUR/USD reversed and declined earlier today. Taking this fact into account, it seems that the pair will extend drops and we’ll see another test of the green support line in the coming day(s). Please keep in mind that another sizable move to the downside will be more likely if we see a daily close below the 50-day moving average and the green support area.
Very short-term outlook: bearish
Short-term outlook: mixed with bearish bias
MT outlook: mixed
LT outlook: mixed
Trading position (short-term; our opinion): Short positions (which are profitable) with a stop-loss order at 1.1667 are justified from the risk/reward perspective at the moment. We will keep you informed should anything change, or should we see a confirmation/invalidation of the above.
USD/JPY
Quoting our Friday’s Forex Trading Alert:
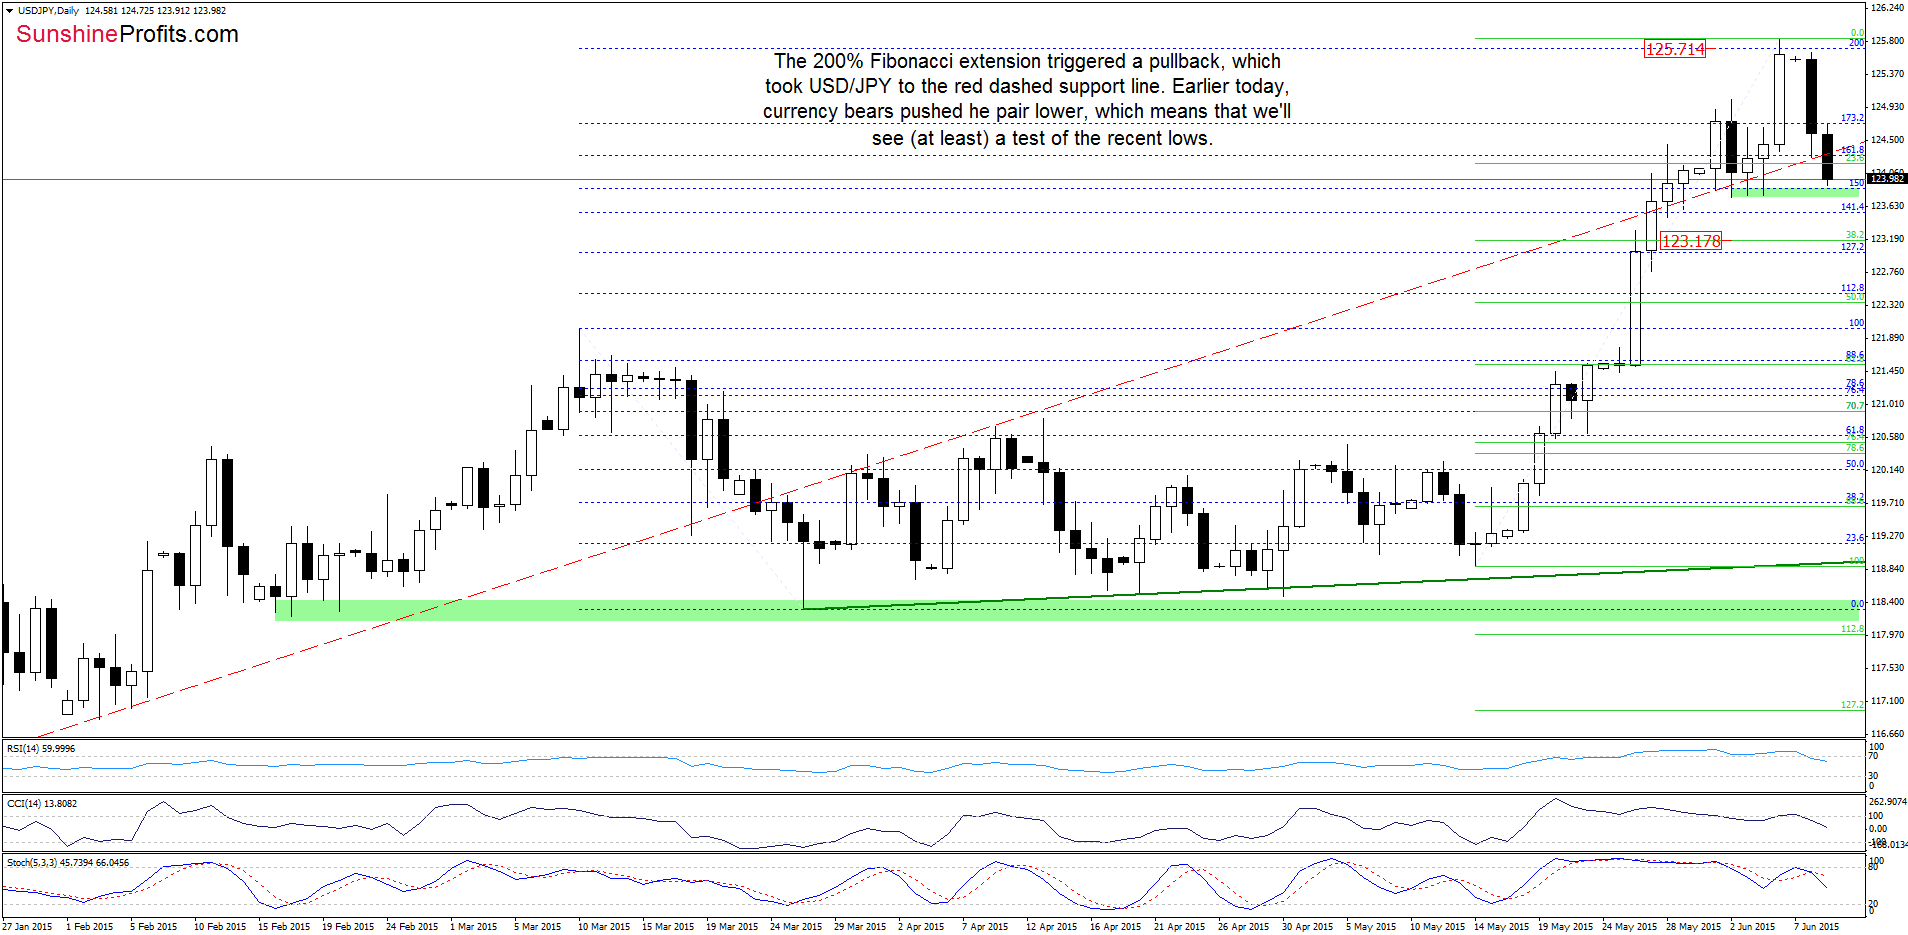
(…) If the exchange rate breaks above the June high of 125.04, we’ll likely see an increase to around 125.71 (the 200% Fibonacci extension)(…)
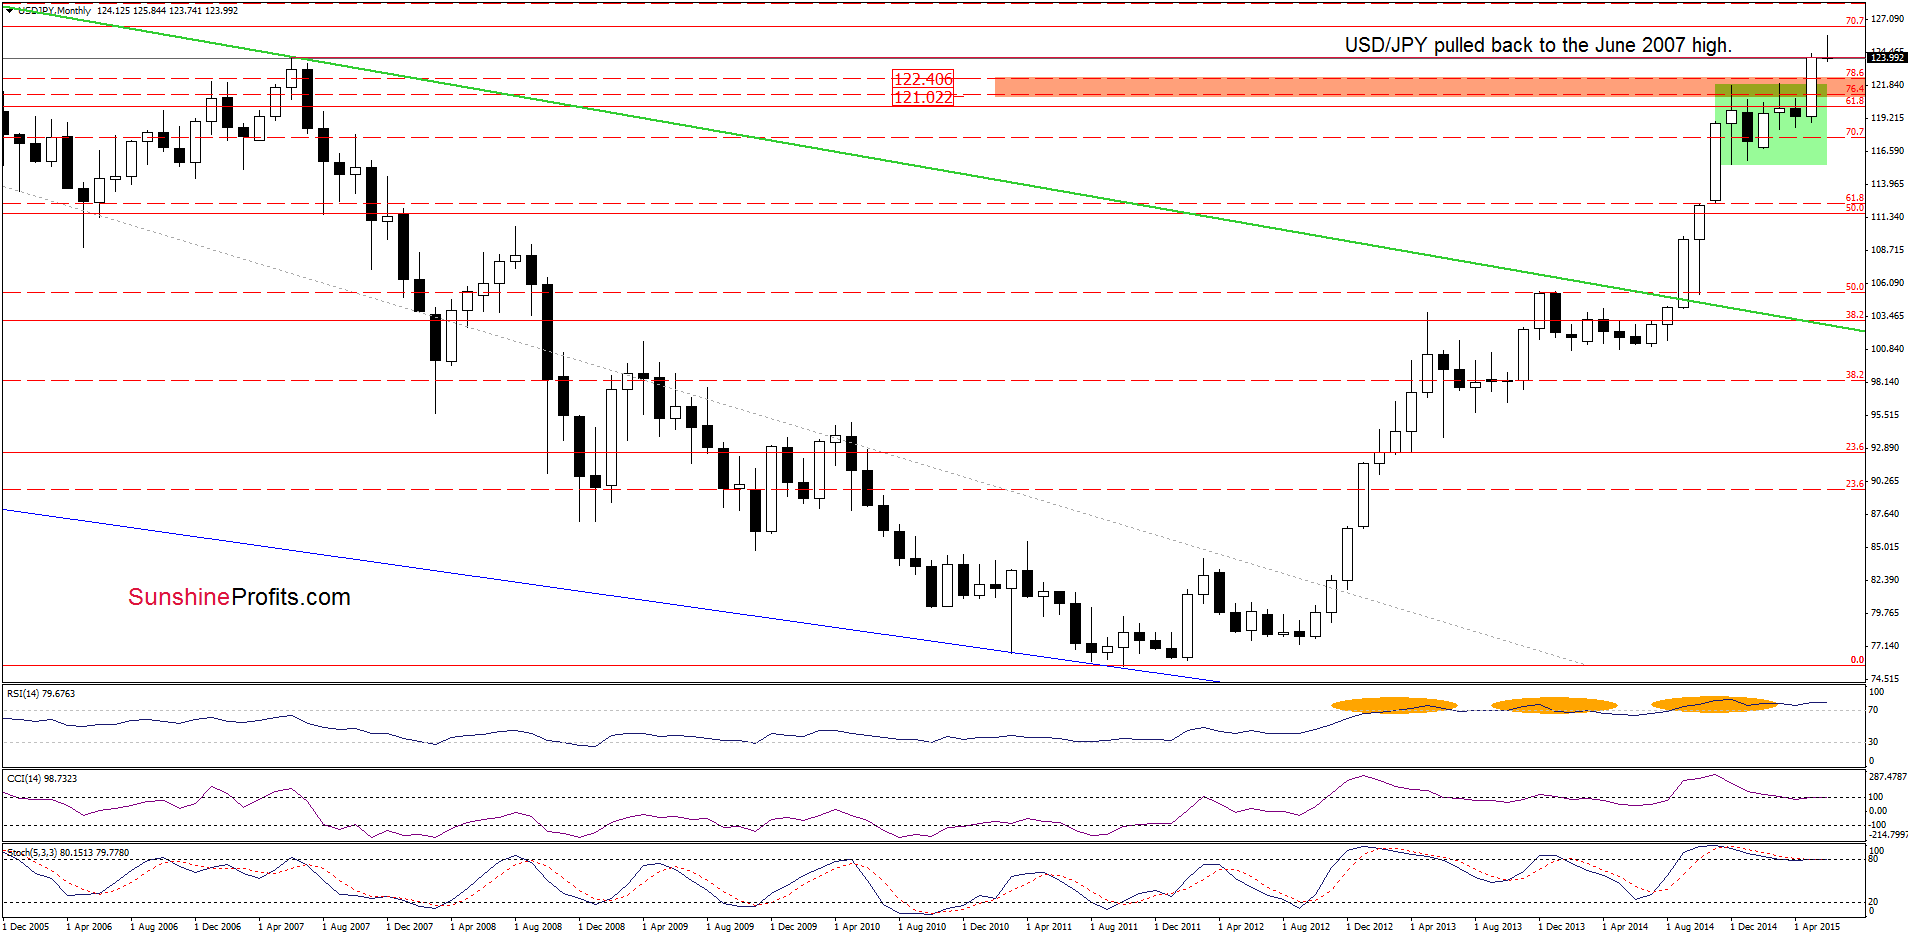
On the daily chart, we see that currency bulls took USD/JPY higher (as we expected) and the exchange rate reached our upside target. Despite this improvement, the 200% Fibonacci extension stopped further rally, triggering a pullback, which took the pair to the red dashed support line. Earlier today, currency bulls pushed the exchange rate lower, which means that we’ll see a test of the recent lows (and the Jun 2007 high marked on the monthly chart). If this area withstands the selling pressure, USD/JPY will rebound from here and test the red dashed line, which serves now as resistance. Nevertheless, taking into account sell signals generated by the daily indicators, it seems that we’ll see lower values of the exchange rate in the coming days. If this is the case, and the pair drops under the green support zone, we’ll see a decline to around 123.18, where the 38.2% Fibonacci retracement (based on the recent upward move) is.
Very short-term outlook: mixed with bearish bias
Short-term outlook: mixed
MT outlook: mixed
LT outlook: bullish
Trading position (short-term; our opinion): No positions are justified from the risk/reward perspective at the moment. We will keep you informed should anything change, or should we see a confirmation/invalidation of the above.
USD/CHF
In our last commentary on this currency pair, we wrote:
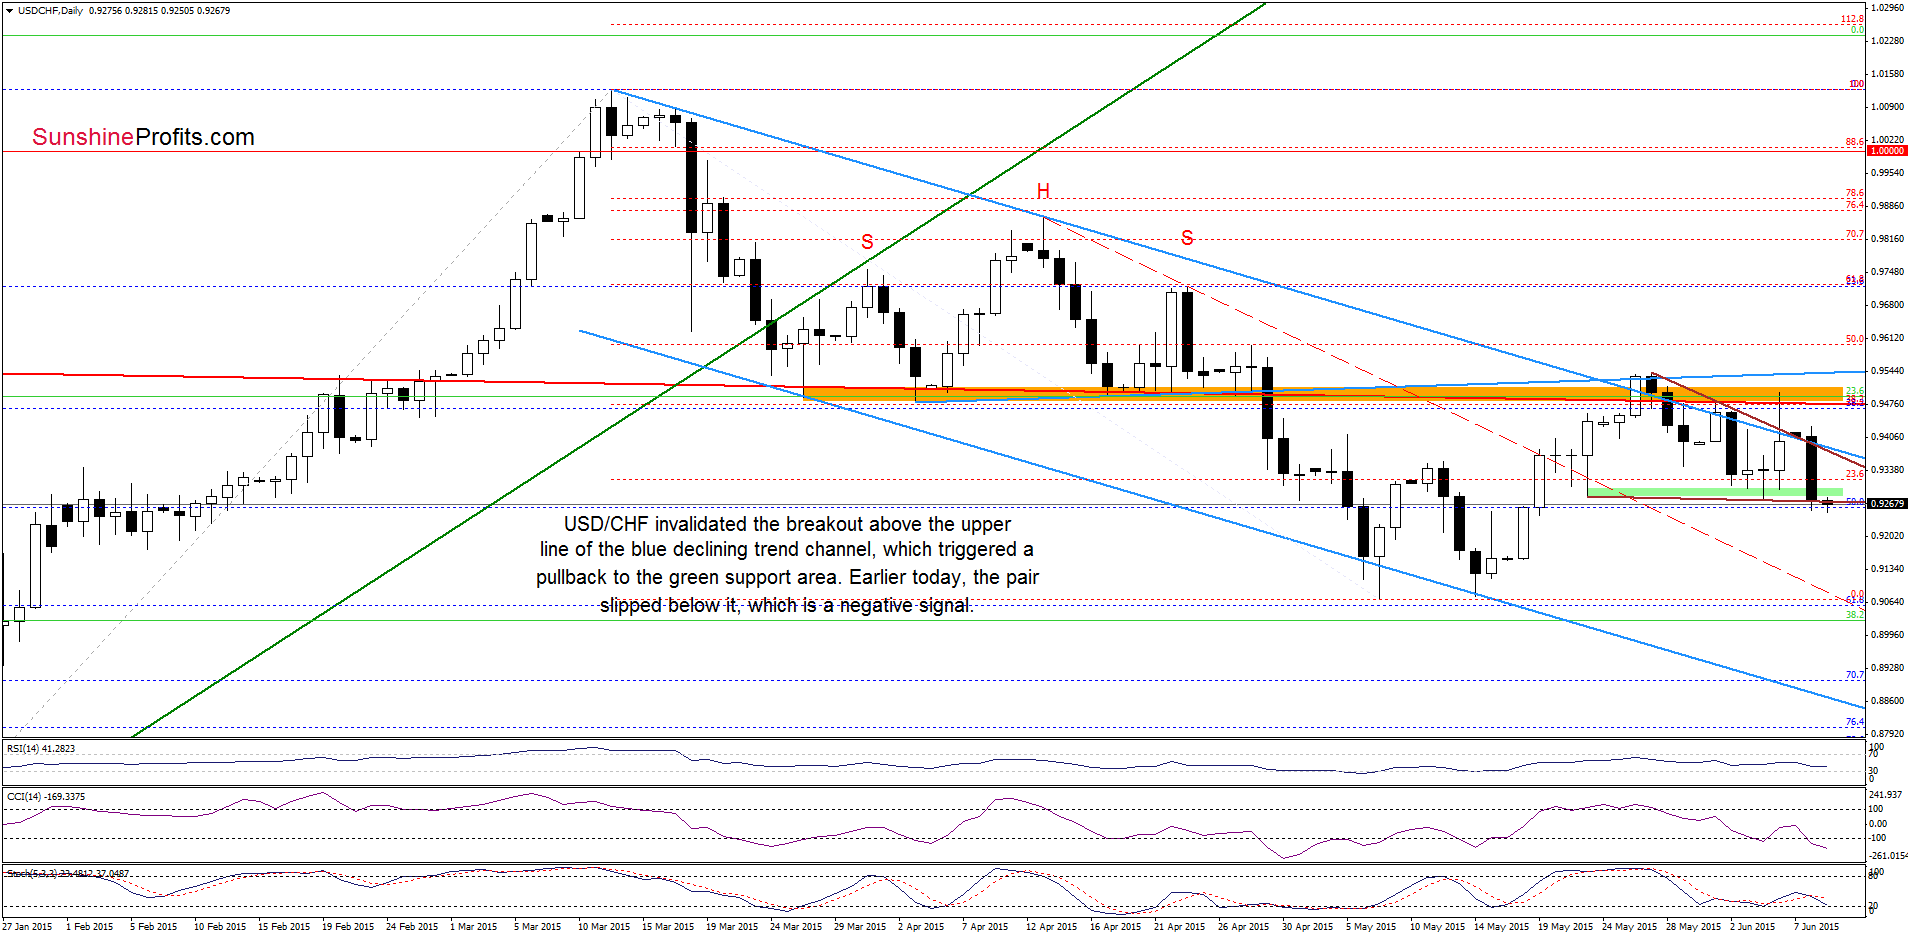
(…) the exchange rate reached the green support zone. Taking into account the medium-term picture and the current position of the indicators (…) it seems that USD/CHF will rebound from here (…) the initial upside target would be the brown (upper border of the triangle) and blue (the upper line of the declining trend channel) lines – currently around 0.9420.
From today’s point of view, we see that the situation developed in line with the above scenario and USD/CHF reached our upside target. With Friday’s upswing, the pair re-tested the orange resistance zone (created by the Mar and Apr lows and the long-term red line), which stopped further improvement and triggered a sharp decline to the green support zone. Earlier today, USD/CHF slipped below it, which is a negative signal – especially when we factor in the fact that today’s drop took the pair also under the lower border of the brown triangle. If currency bulls do not invalidate this breakdown in the following hours, and the exchange rate closes the day below these levels, it would be a bearish signal, which will likely trigger further deterioration. In this case, the initial downside target would be around 0.9070-0.9080, where the May lows are. On the other hand, if the green area withstands the selling pressure, the pair will test the brown and blue resistance lines once again.
Can we infer something more from the weekly chart? Let’s find out.
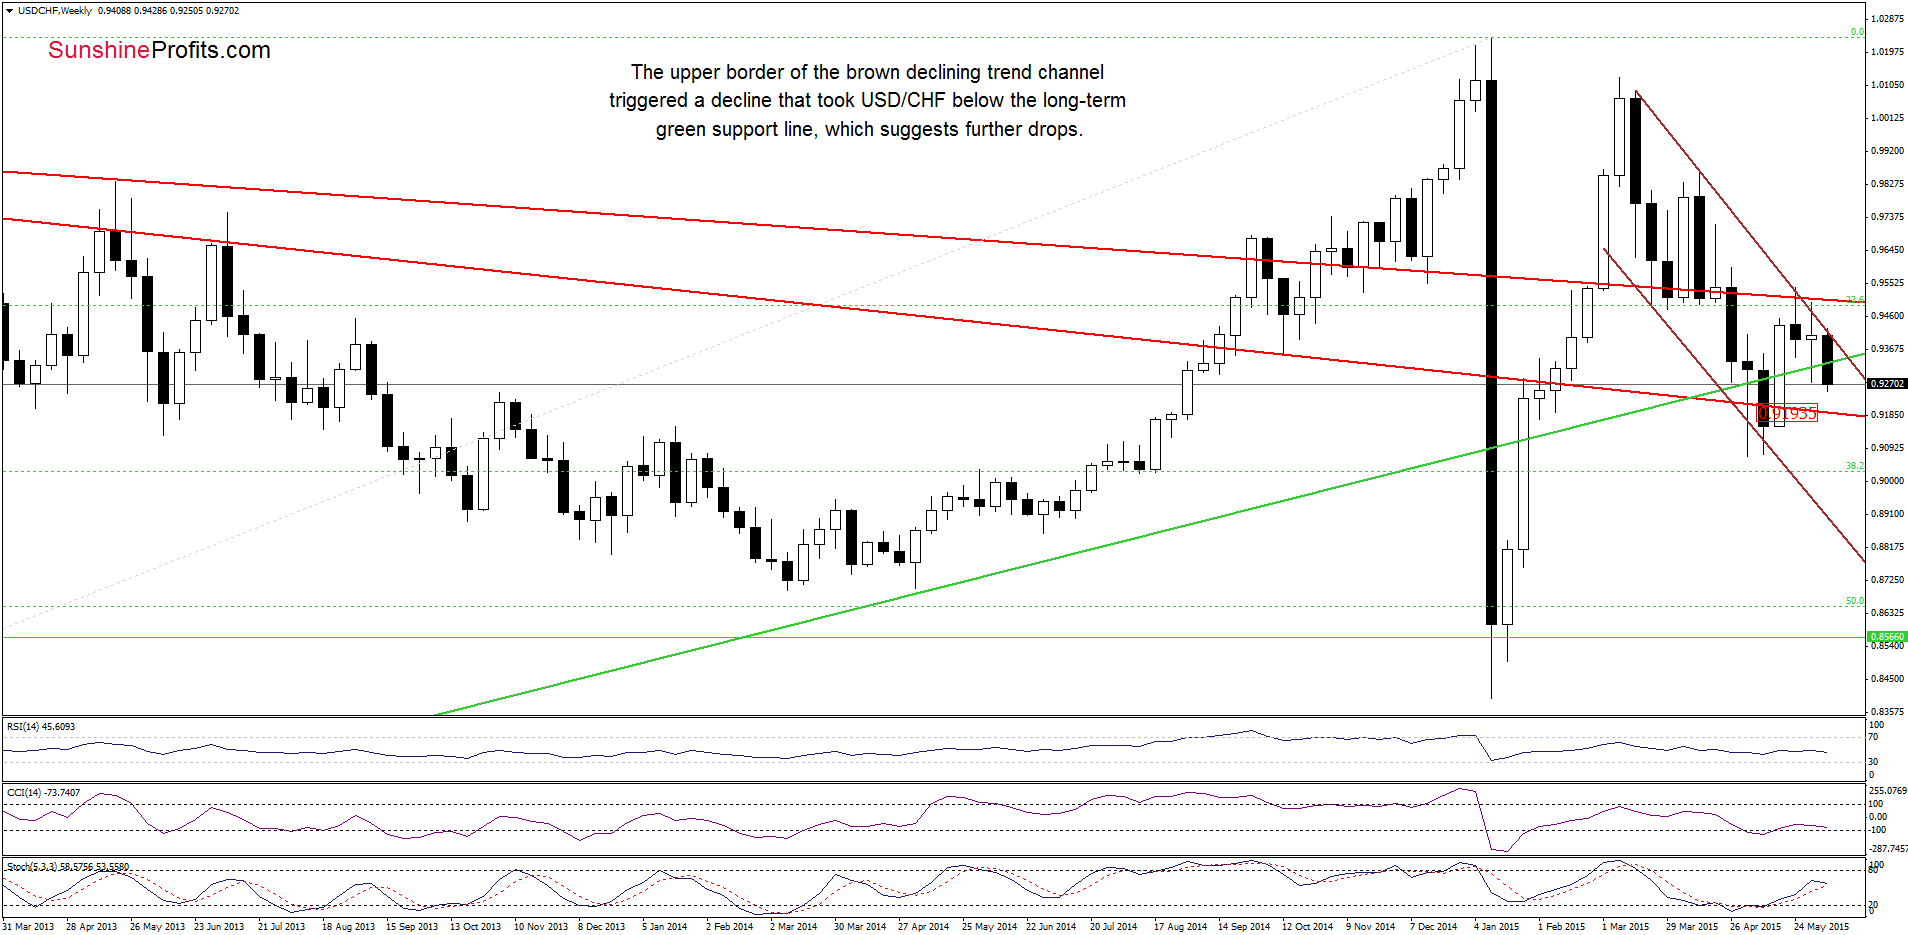
Looking at the weekly chart, we see that the upper border of the brown declining trend channel triggered a sharp decline, which took USD/CHF below the long-term green support line. This is a negative sign, which suggests further deterioration and a drop to around 0.9194, where the lower long-term red support line is.
Very short-term outlook: mixed with bearish bias
Short-term outlook: mixed
MT outlook: mixed
LT outlook: bearish
Trading position (short-term; our opinion): No positions are justified from the risk/reward perspective at the moment. We will keep you informed should anything change, or should we see a confirmation/invalidation of the above.
Thank you.
Nadia Simmons
Forex & Oil Trading Strategist
Przemyslaw Radomski, CFA
Founder, Editor-in-chief