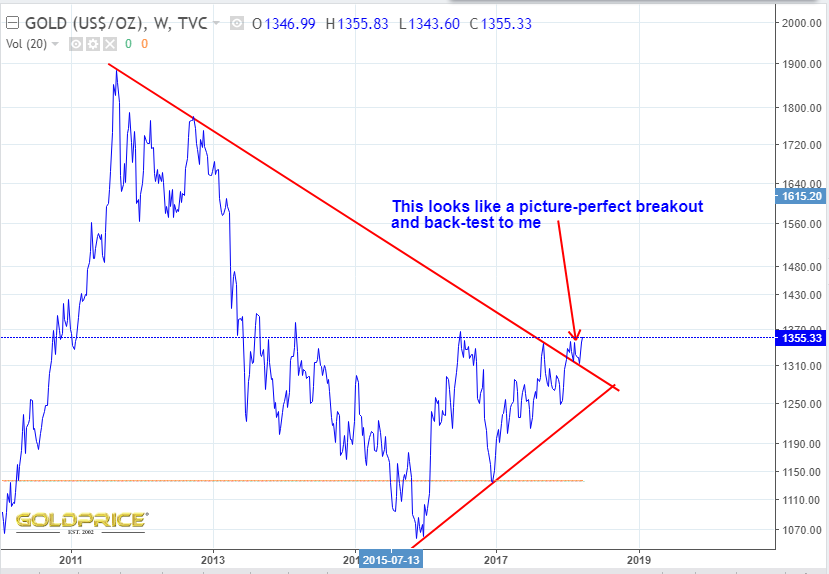
Gold Weekly Log Chart
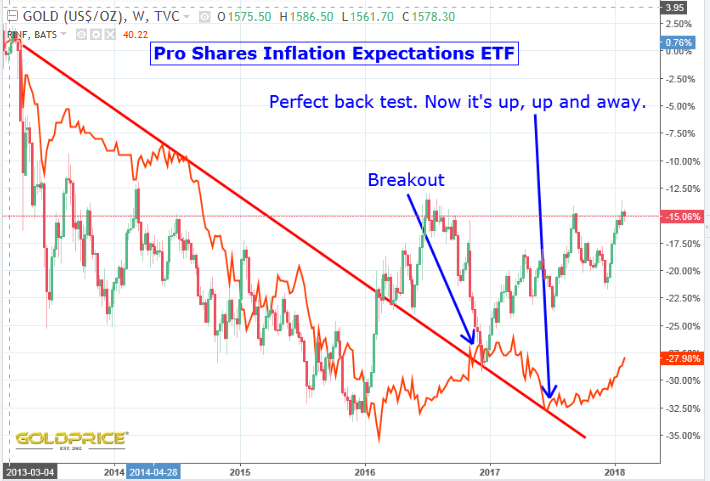
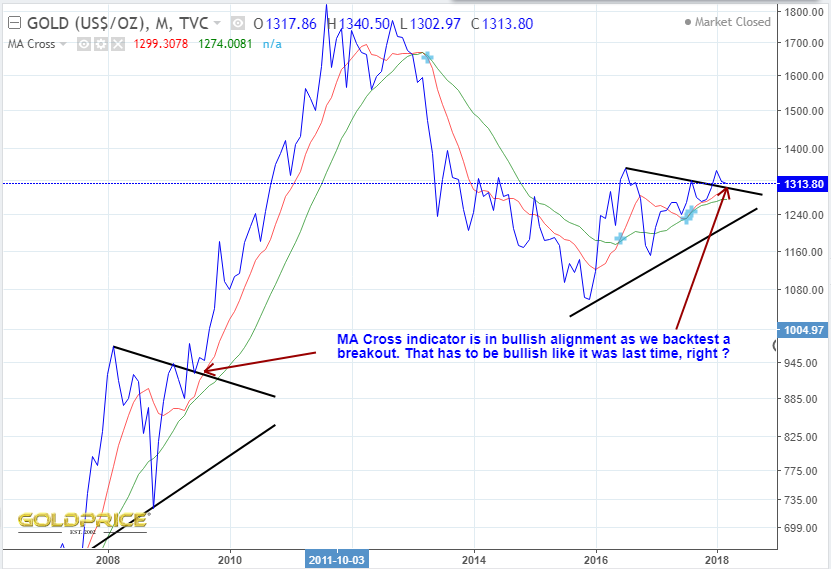
Still looking good to me. Rising after a backtest of the breakout.
Still looking good to me. Rising after a backtest of the breakout.
Again, it’s all in the chart…
The chart says it all…
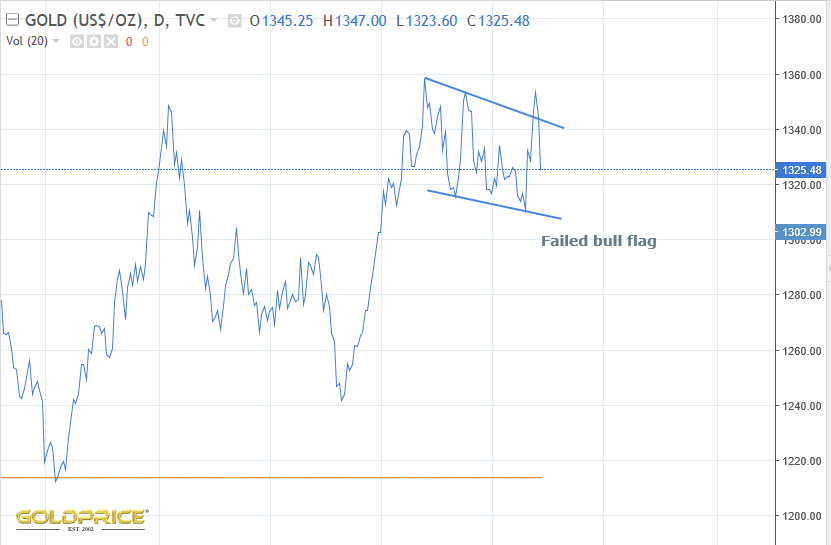
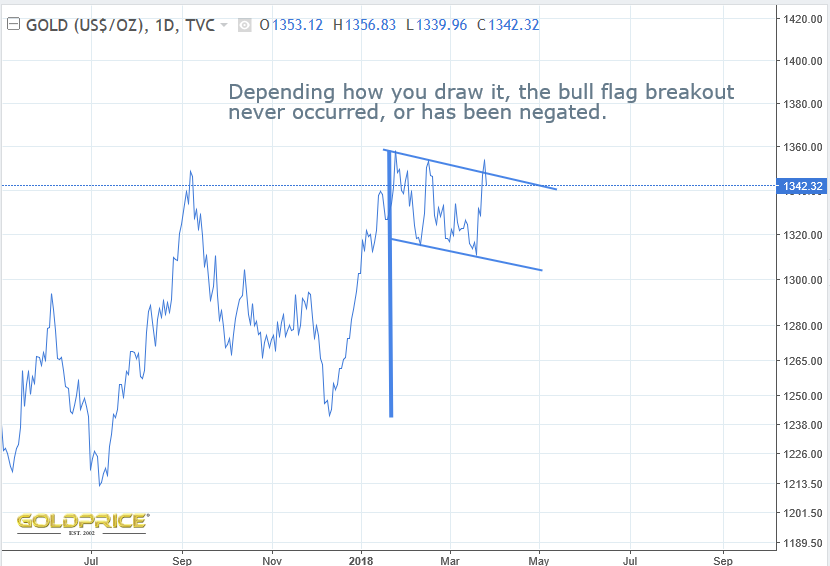
The bull flag breakout, I posted has failed…
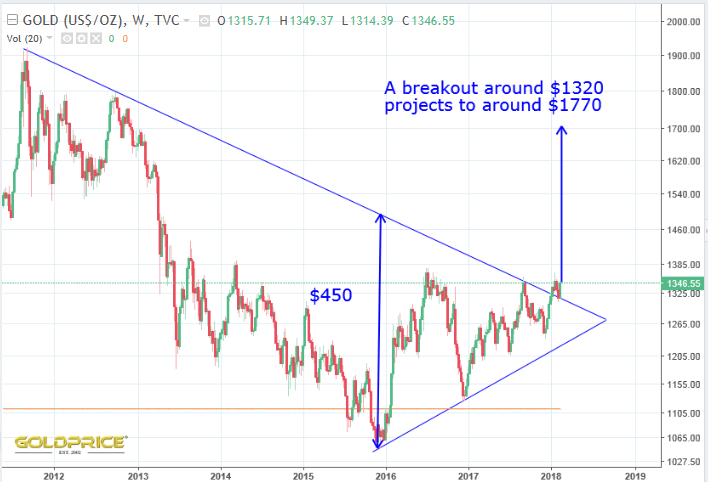
But the larger triangle formation is still valid. If we don’t break out this week, we could see a drop of $50 or more…
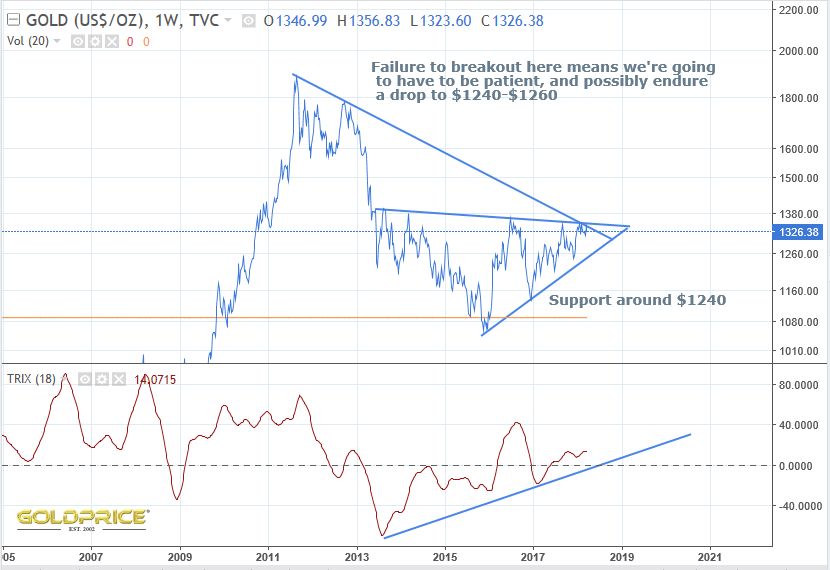
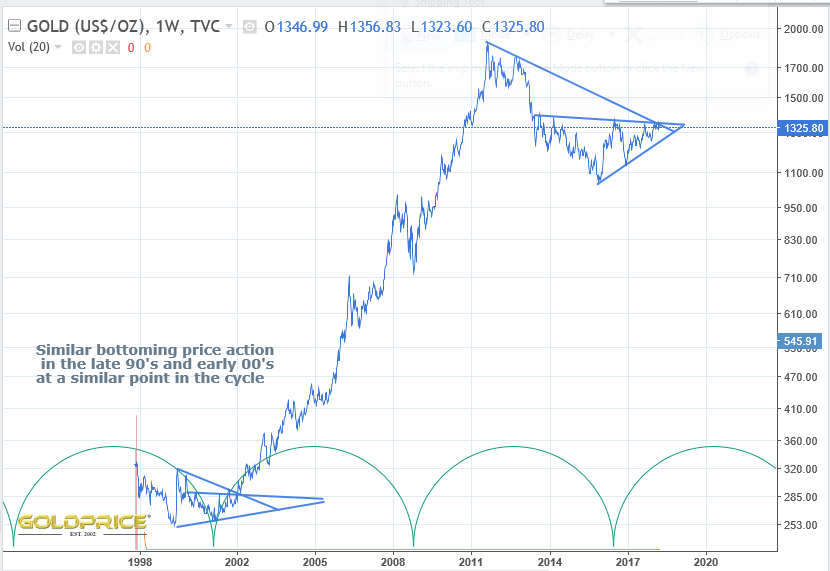
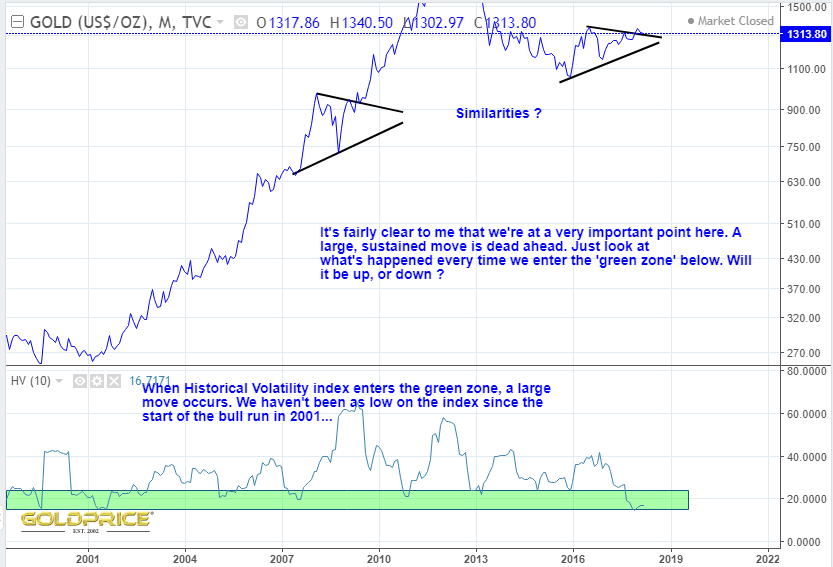
This isn’t the first time we’ve been at the start of a gold bull cycle and seen this chart formation…
And there’s still one piece of good news. The breakout is still holding on the daily chart…

Lets see where we close the week. I’m off for a nightcap 
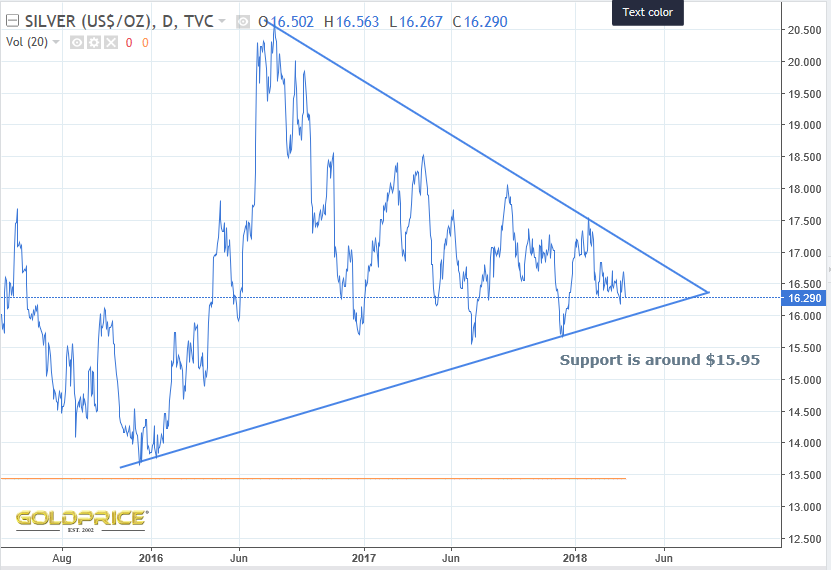
What a shocker, but the week isn’t over yet. First up, support looks to be in the $15.95 region. Anything more than a short, sharp spike below that, and I’ll be a) very surprised, and b) shitting my pants. Here’s the chart…
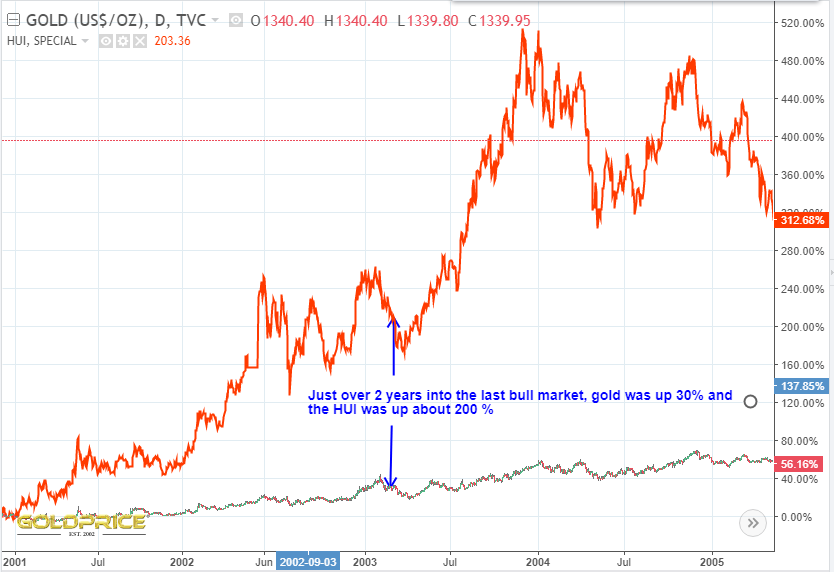
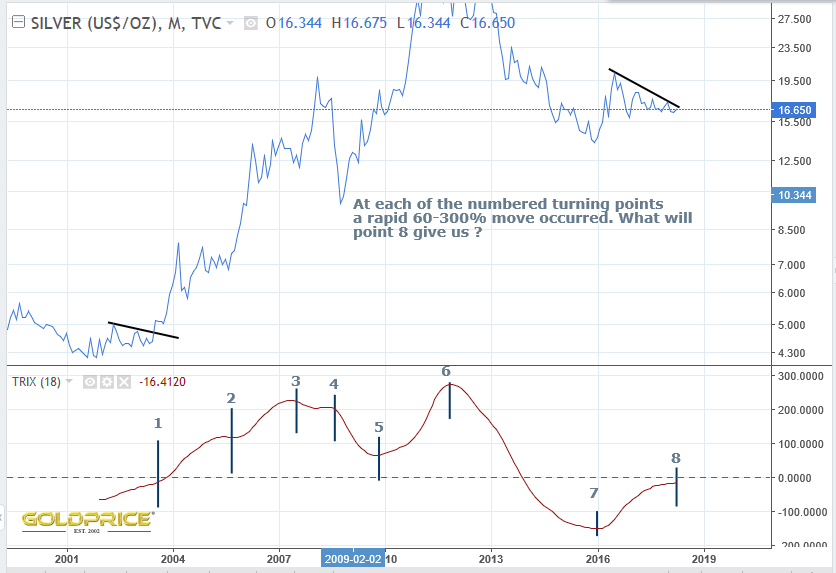
Assuming I don’t need a trip to the dry cleaners, this chart shows a similar set up in the past…
However, looking more closely, I think we need to go back a few years, closer to the start of the last bull. It makes sense, that if we really are in those early stages, we may have been in a similar position back then. Guess what ? We were…
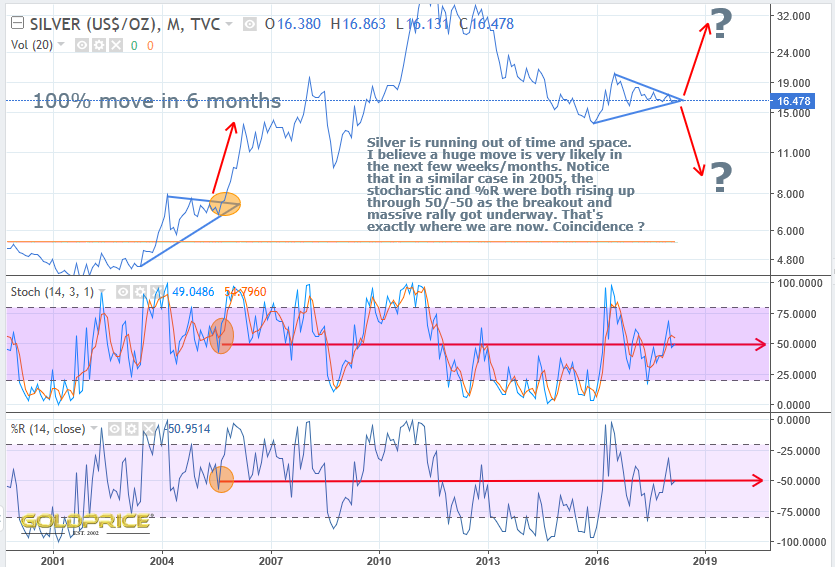
The similarities are striking, wouldn’t you agree ? The apex in my first chart closes up in the Summer. Interestingly, the dollar is hovering just above a key technical level (the 200 day moving average). Simultaneous moves are looking to be on the cards, in several markets. This is a key point, and a classic ‘point of recognition’. If and when we cross those thresholds, some very big moves will follow. Just look at the chart above. Silver nearly doubled in value very quickly. Hi ho Silver
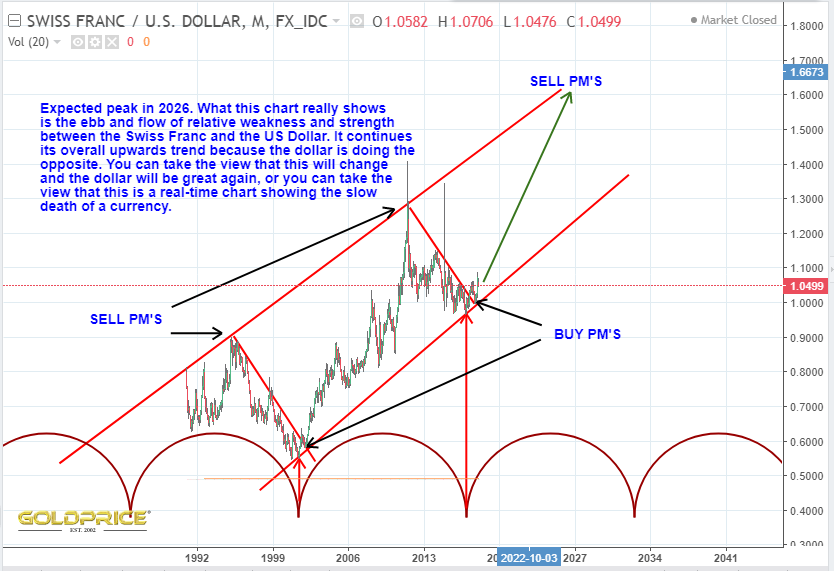
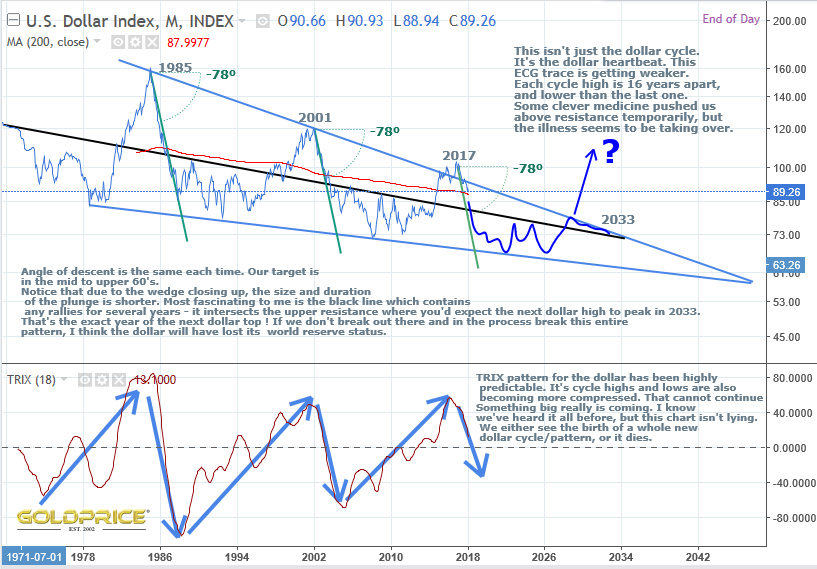
I haven’t seen too many (if any) charts that show clearly how, why and most importantly, when the dollar is going to die. My view – no later than 2033. It appears to me that the dollar will fail during its next cycle. Either the dollar is dead by then, or it will be reborn. The status quo cannot continue (and I’m not talking about the quirky British rock group who had their heyday back in the ’70s).
As I’ve said before, cycles are all around us. Some are relatively stable (for now), like the seasons and the tides. All are terminal though, eventually. What often happens is that a cycle becomes unstable, breaks down, collapses the system, and a new one is reborn out of the ashes. There are too many to mention, but think volcanoes, earthquakes and hurricanes. Pressures build up, a cycle starts and builds towards a massive release of energy and destruction, and the whole thing goes into a quieter phase until the cycle builds again. A human life is also a cycle. Birth, growth, maturity, decay and death.
Now that I’ve cheered you all up, consider the mighty dollar. It certainly isn’t the worlds first reserve currency, so why should it be the last ? There are multiple signs that its dominance is drawing to an end. This is obviously a massive deal for investors. Knowing when this is going to happen puts you one step ahead. I think it’s becoming clear where the power is shifting. The petroyuan is now trading, and gold backed currencies are highly likely in China and Russia – just look at how they’ve been accumulating gold in recent years. If reserve status moves east, the implications for PM’s are beyond anything we’ve seen in the last 100 years. Sounds dramatic doesn’t it ? But just think for a moment…For holders of gold/silver in the west, what do you think will happen to the value of your holdings when measured in your local currency if the dollar loses reserve status and global trade deals are no longer settled in dollars. What would be the implications for US debt/inflation ? That’s a whole different discussion. For now, lets just look at what the chart is telling us, and let it sink in.
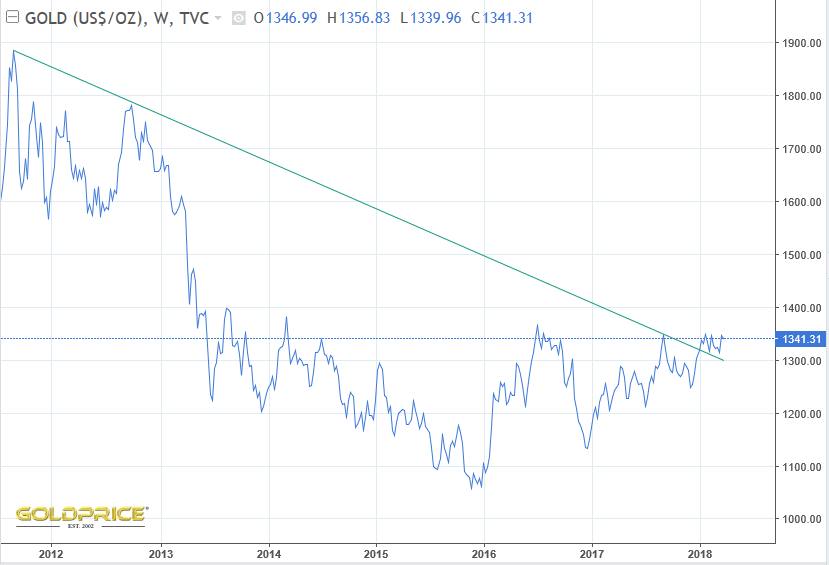
So it’s game on – gold has broken out on the weekly chart below, with the descending green line support at around $1300.
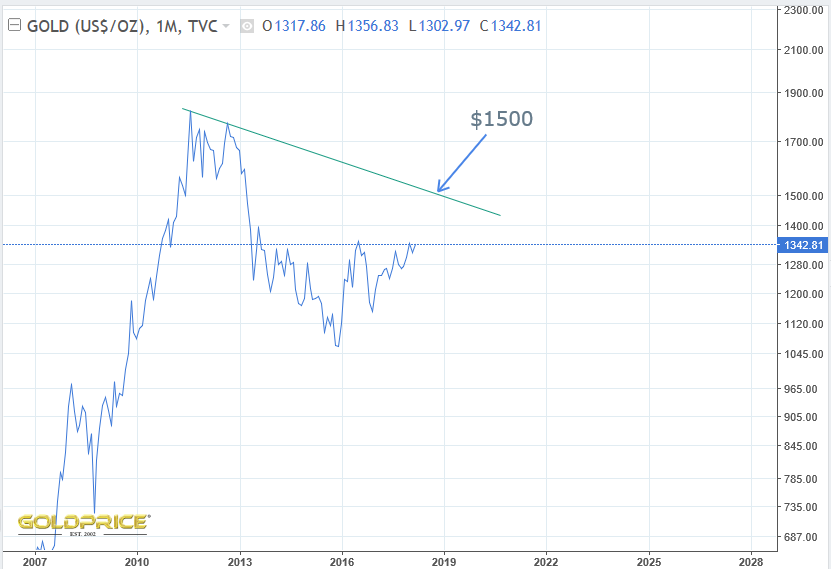
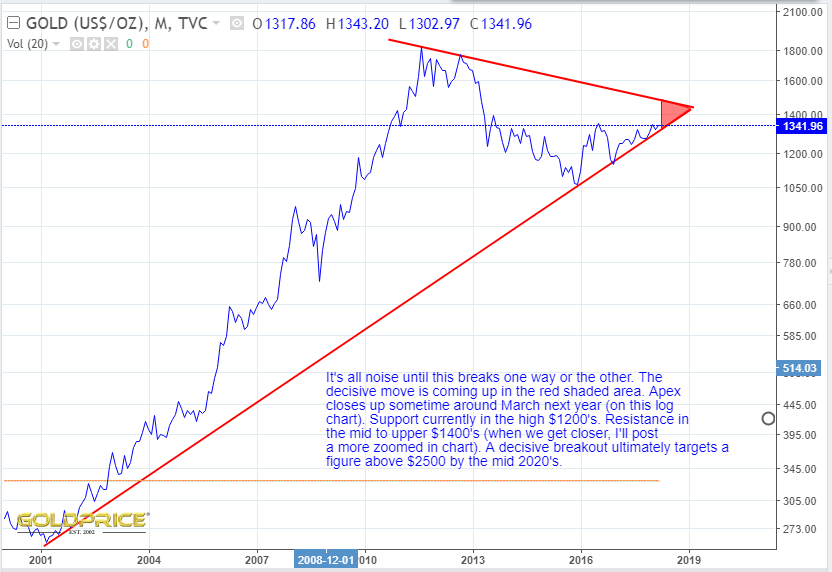
However, the monthly chart below is very different, and we’re a long way from breaking out of that one. This is primarily due to the lower starting point at the 2011 top resulting in a much shallower slope.
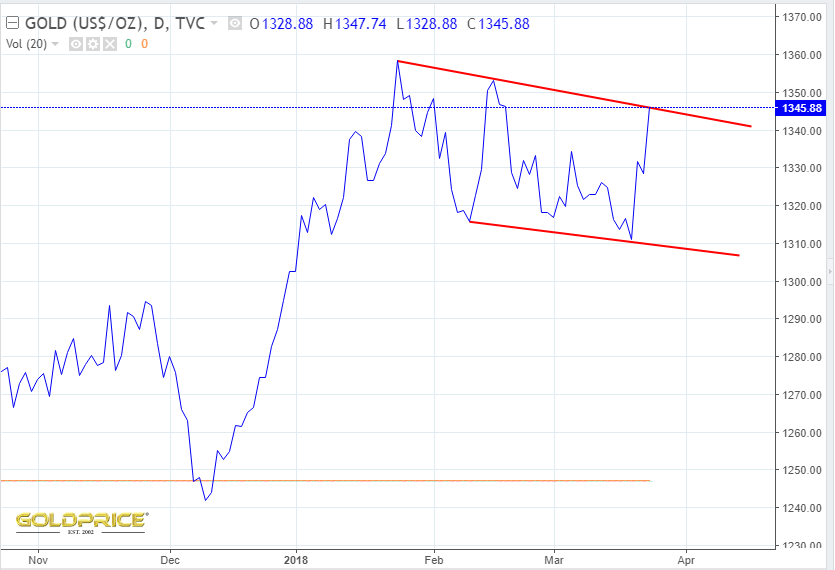
The bull flag I posted previously (as Fully has just shown), either didn’t occur, or has been aborted – depending on your charting software and how you place your lines. Either way, it’s concerning.
In contrast to the bullish case, here’s a look at a bearish possibility…
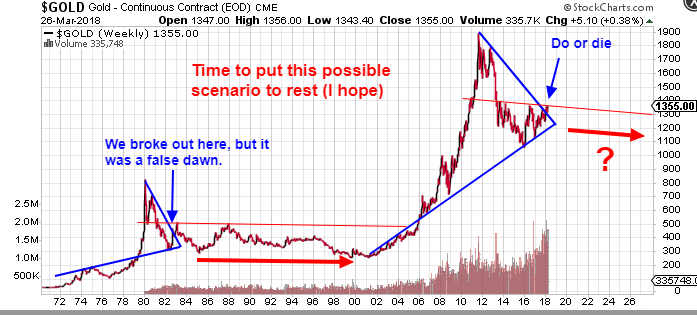
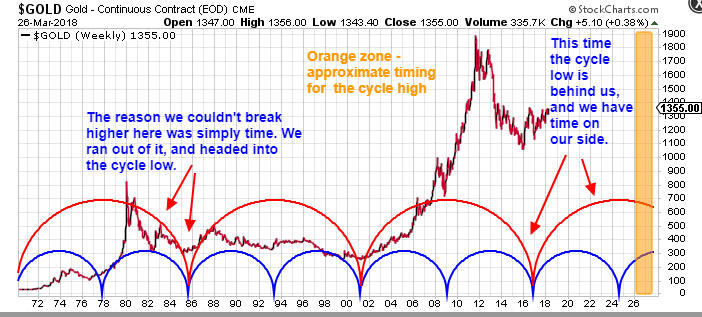
On the face of it, we could be looking at a sideways grind for at least 15 years. I’ve posted many, many times explaining why I don’t think that’ll happen, but here’s one of the biggest reasons. Time.
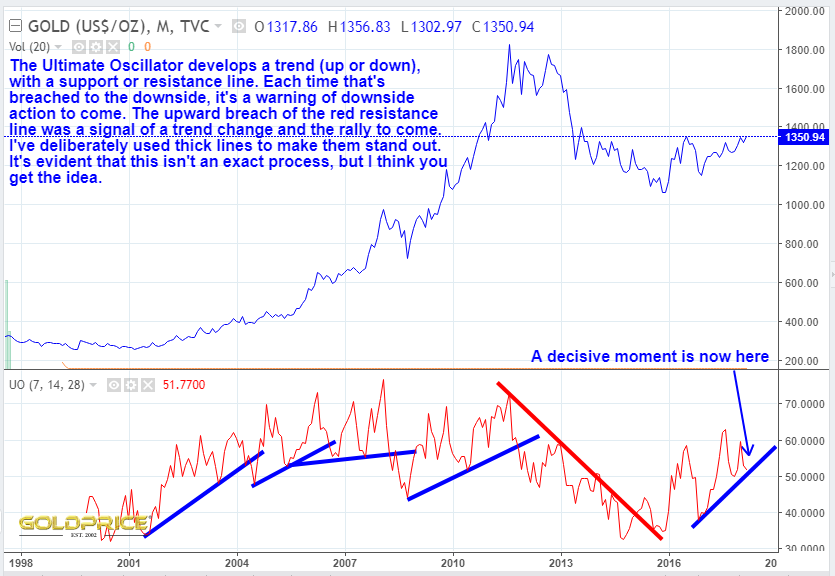
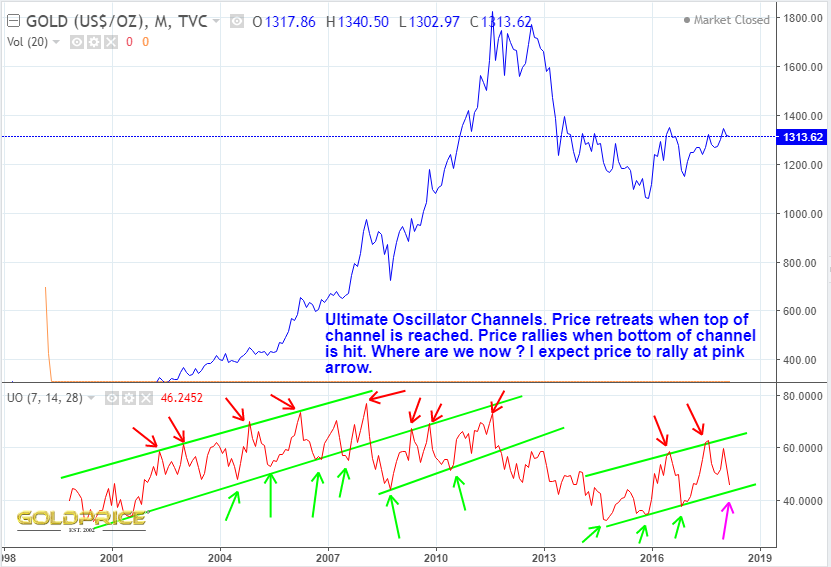
And finally, another look at my new favourite indicator, the one, the only, the Ultimate Oscillator
Come on now gold, don’t let us all down 
Edit: ‘2016 top’ corrected to ‘2011 top’. Oops.
This looks like a game-changer to me. Never mind inverse head and shoulders, necklines etc, gold (on this log chart) has broken out of a wedge formation going back 18 years ! This at a time when the dollar cycle peak is behind us and the gold cycle peak is ahead of us in the mid 2020’s. The masses are clueless, but we’ve been expecting this since the gold cycle bottomed over 2 years ago. Unless something goes badly wrong (something I’ve missed), and if we close above the support line at the end of this week, I’m as close to certain as I’ll ever get, that big moves are coming this year rather than next. The next stage of our young bull looks as if it can’t wait. Silver is likely to explode higher quite dramatically, and the miners could double by the end of the year. I’m still expecting the dollar to plunge another 8 points or so in the next 4 to 8 weeks.
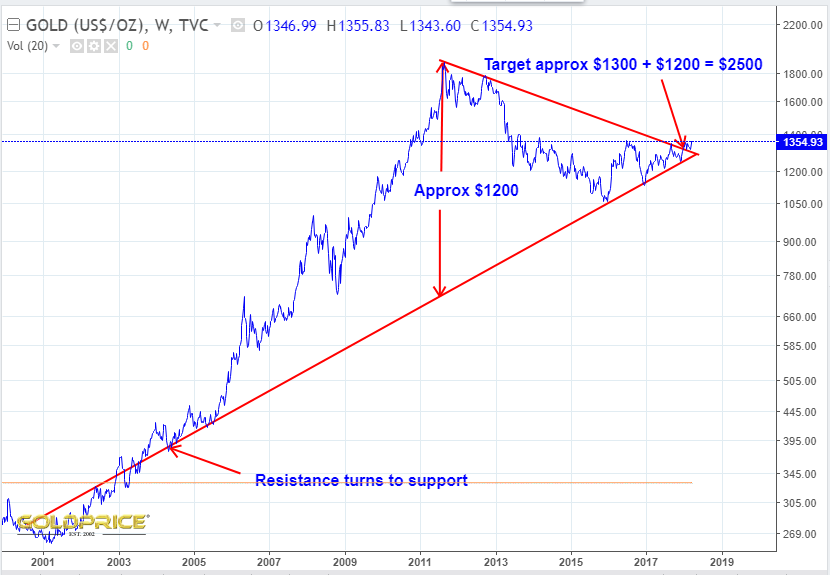
Now zoomed in…
The $2500 target may be a little conservative, especially if the new petroyuan decimates the dollar (which is quite possible).
If you think that’s possible, it might be worth reading this. Its been common knowledge for ages, but now it’s here
Especially if we get a bullish monthly close next week. Let’s see if this move can be sustained.
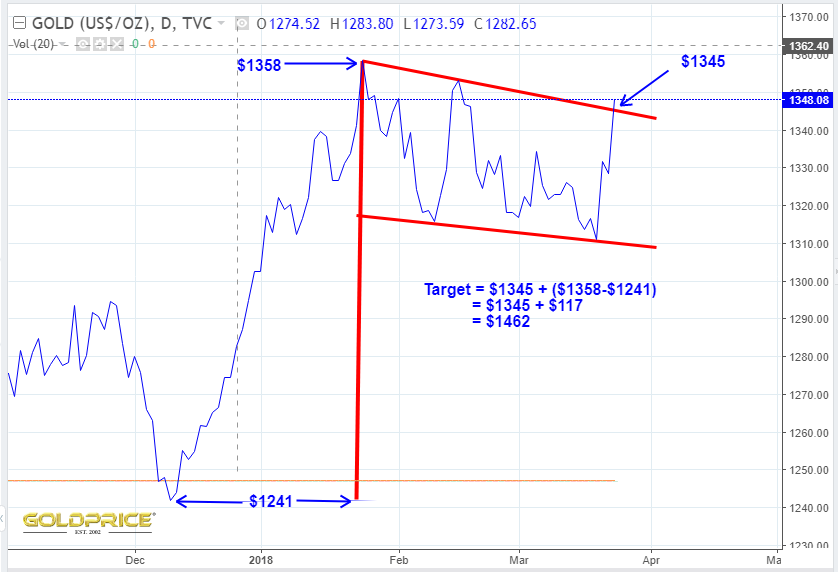
Bull flag breakout ?
…some way to go yet
Ensemble Forecasting. It’s something we use as a matter of routine to help us forecast what is LIKELY to happen with the weather several days ahead. The way it works is that you take all the known CURRENT weather data (globally). That means current, real time observations of temperature, humidity, air pressure, wind speed and direction and a lot more. Not just at the Earth surface, but all the way up to the top of the atmosphere, using satellite sensing techniques, aircraft data, weather balloon data etc. We then run it through the computer model and project it forwards one hour, 6 hours, 12 hours, 24 hours, a week etc. That gives you one possible future forecast. We then ‘tweak’ the input data,because we have an incomplete picture of current conditions. We don’t have data for every inch of the planet (just wherever the data recording instruments happen to be sited). We then run the model again, and get a different forecast. We do this many times, getting output that shows us all possible future weather outcomes several days ahead. Most of the time the forecast for city X is broadly similar under most of the possible future outcomes, but the further ahead you go, and the more ‘chaotic’ the atmosphere happens to be at the start (during stormy Winter weather for example), the more chance there is that there are several possible future scenarios.
An example might be that out of 100 predictions for London next weekend, we get 70% dry, sunny and cold, 20% warmer with rain, and 10% heavy snow. At that point, we suggest the most likely weather next weekend is dry, sunny and cold, but hint that there is still a degree of uncertainty. The important bit is to run the whole process again 6 hours later and see how the odds have changed, and to keep doing that because confidence levels always increase as the event approaches, and begin to point in the correct direction.
It’s exactly the same with trying to make financial predictions, except, instead of gathering weather observation data, we’re gathering evidence from a massive array of sources (all the indicators I showed you yesterday, plus many more, COT data, bond yields, the dollar, cycle data, interest rates, and so the list goes on). It’s vitally important to learn what it is that each piece of data may, or may not, be telling us. For example, interest rates. Gold can go up or down as rates rise. Real rates are more useful, but you need supporting evidence. It’s no use if only a handful of data is suggesting gold will rise, you need to ‘build a case’. That’s what I’m trying to do. If an indicator is not predictive on its own you need to look where all the others are pointing.
I’m not too concerned with short, or even medium term moves, as long as the long term support line on our new bull holds (somewhere in the low $1200’s). I’m accumulating PM stocks and plan to exit in about 7-8 years time (I may try to time the top after our next move to the $1450-$1550 area and take some profits).
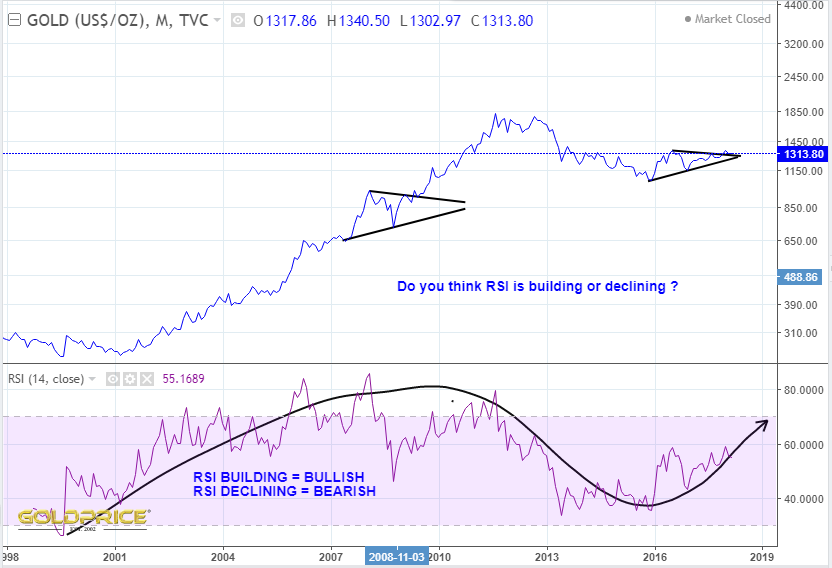
I’ve shown many, many pieces of the jigsaw in my posts – dollar cycle, gold cycle, CHF/USD ratio, real rates, COT, and yesterday, a whole load of indicators. There’s one I haven’t used much in the past – the Ultimate Oscillator. It was developed by Larry Williams, and is a measure of buying or selling pressure. I spent a bit of time looking at how it behaved in the last 20 years or so. The chart is below, with my notes on it. I think it’s worth careful consideration, and is certainly another piece in the puzzle.

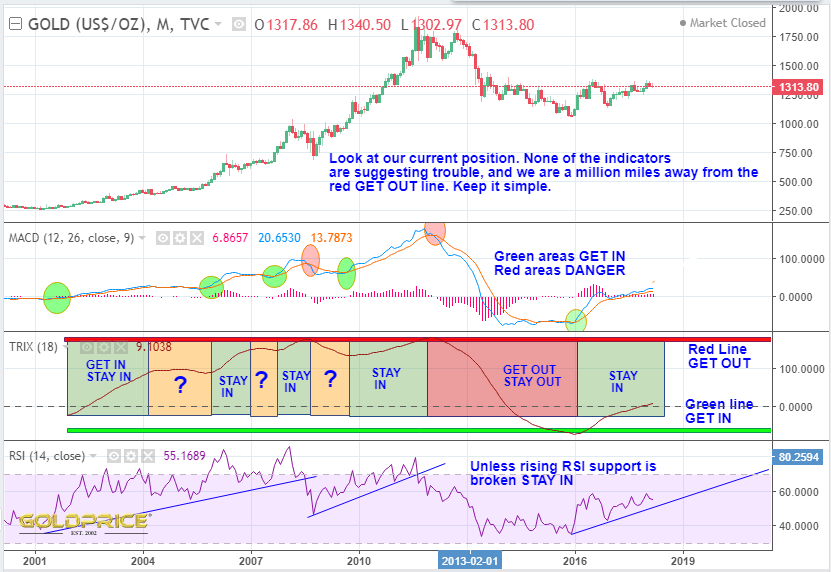
I think we’re going to see a sharp move up in gold price soon. There could still be some downside (maybe $30-$50), but the clues are there in the technical indicators. This is what I’m seeing (notes on each chart should explain everything).

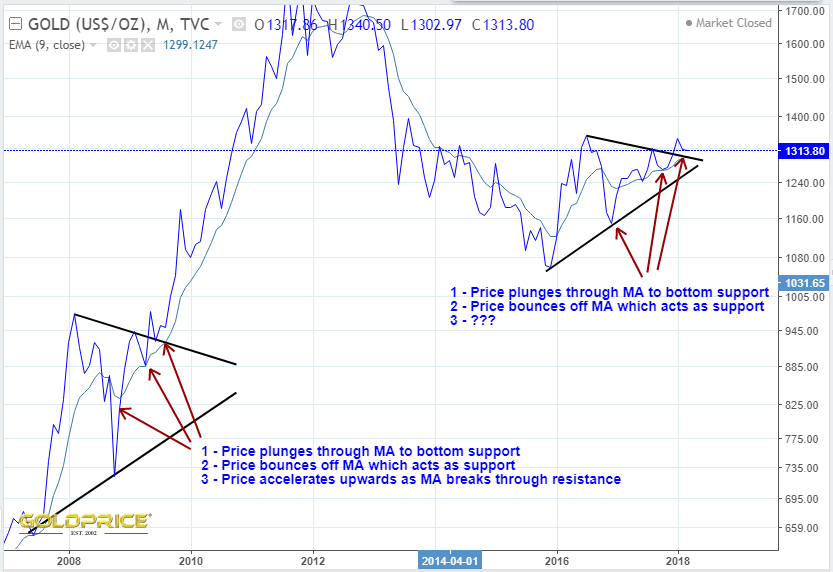

It may come across that I’m a bull, no matter what, but I’m not. This is my honest interpretation of what I’m seeing. It could be completely wrong, of course, but it’s my honest view.
Everything is looking fine. Try to be patient and relax. Unless one of these indicators breaks down, history is telling us not to worry.
The PM doldrums continue. Here’s a gold chart. Nothing too major jumps out at me except that we’re doing just fine, despite miners tanking. My money is still very much on a bullish resolution. The big question is when…
Are getting ridiculous. Gold goes up. HUI goes down. Not good at all 
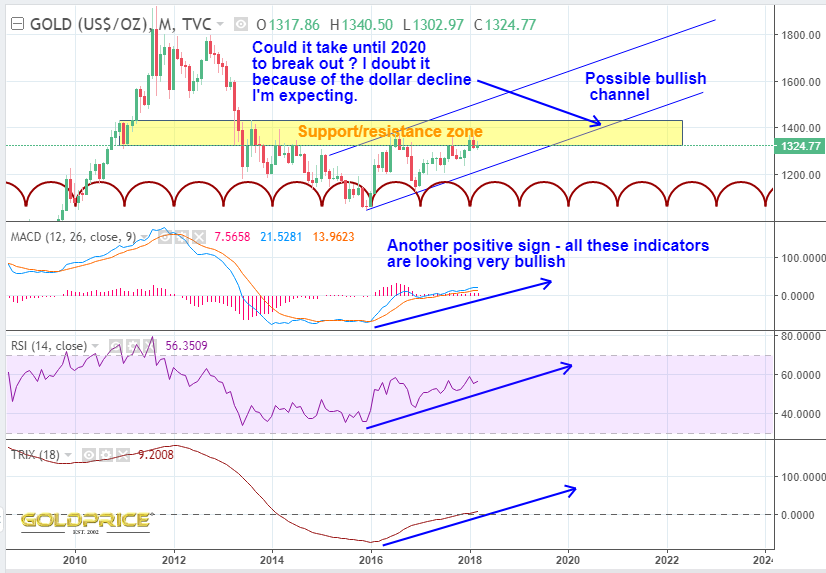
With the dollar sitting on a multi year support/resistance line, and gold simultaneously trying to push through one, we’re on the verge of a simultaneous resolution which may well be explosive in nature. The third chart below shows two of the indicators for gold (I needed to maximise the size of the gold chart to show everything properly). The balance of evidence suggests a dollar breakDOWN and a gold breatOUT is underway. As I’ve said before, a dollar bounce and gold drop are quite possible here, but the primary trend SHOULD be dollar down, gold up.
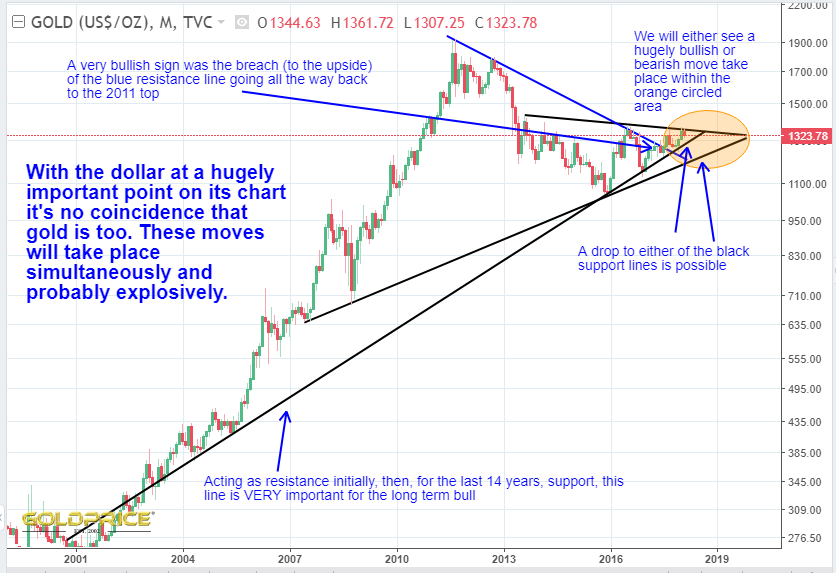
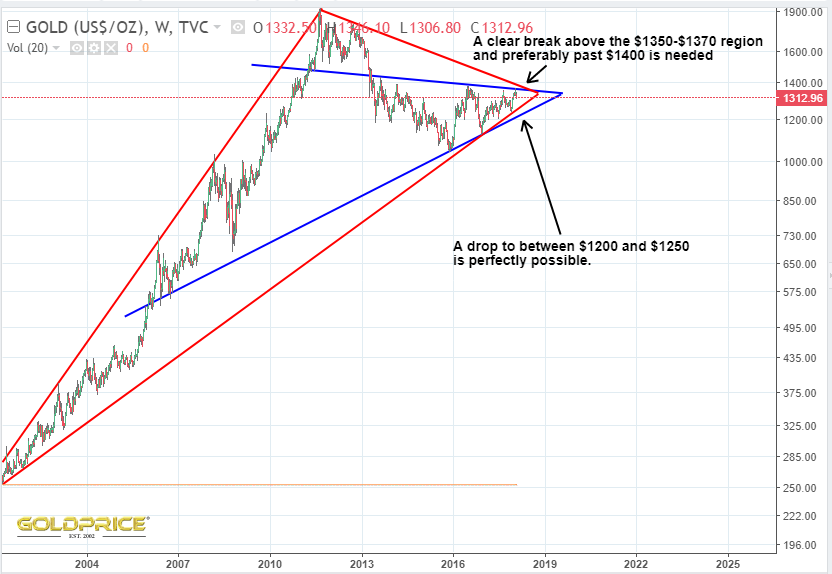
If we’re going to bust through resistance, it needs to happen soon. If not, we’re likely to see a $100 drop in gold price, and another test of support. I would suggest the probability of a breakout at this attempt is finely balanced. The long term indications all suggest to me that an eventual upside breakout will occur. However, a break below support just above the $1200 area is NOT rated as impossible. In my view it’s a very low probability (less than 10%). An upside breakout now, or after revisiting support is (in my view), rated at over 90%.

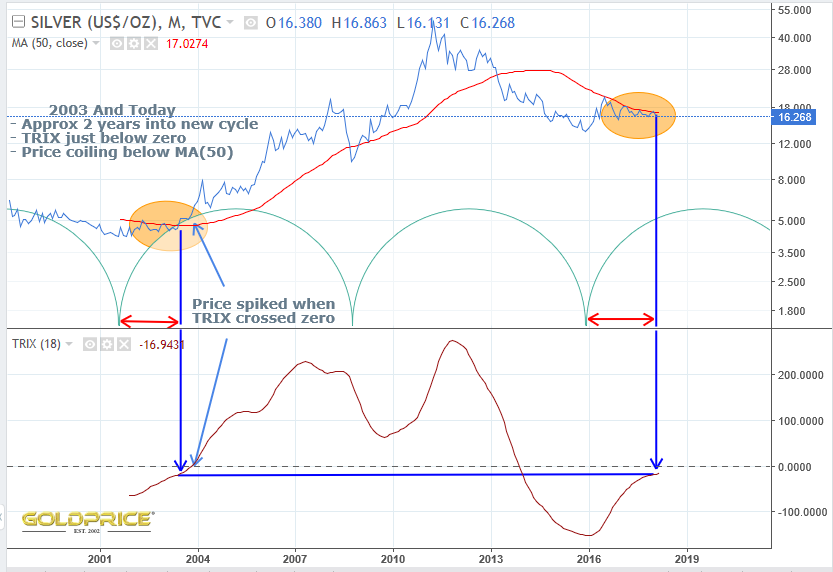
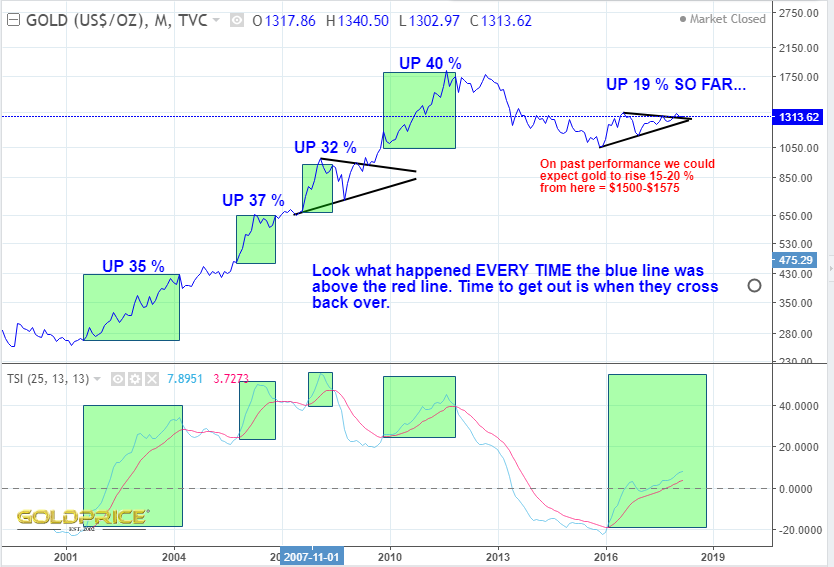
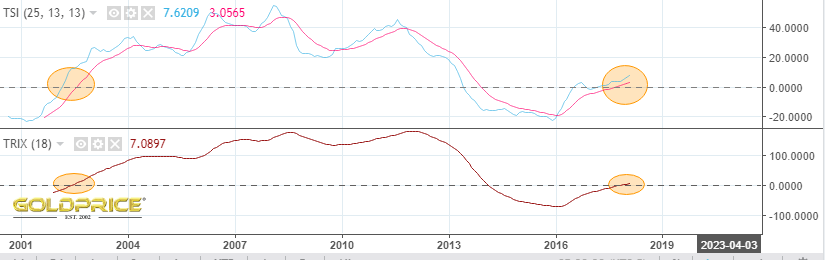
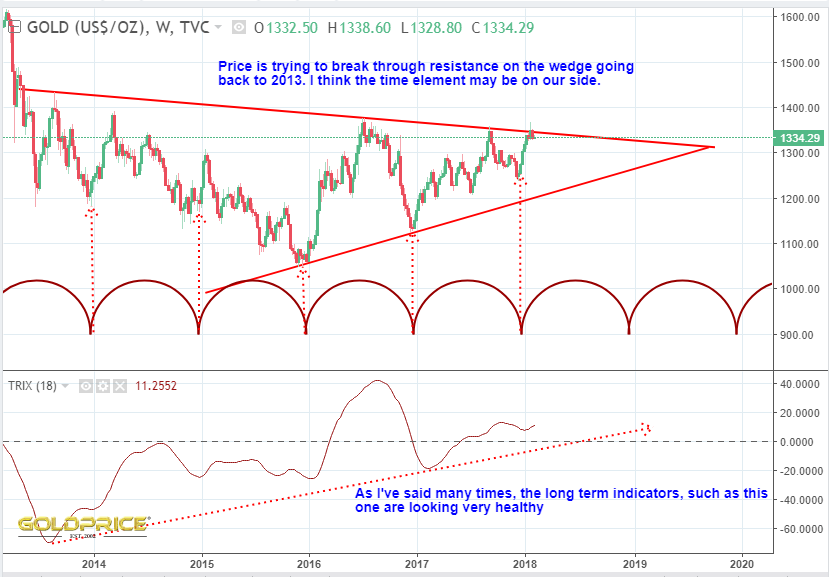
The breakout following the 2008 pullback was accompanied by TRIX turning up and TSI having a bullish crossover. Of more interest to me though, is the current very low, but bullish, up-trending TRIX and TSI. We’re in a similar position to the very early days of the last bull, with enormous upside potential. Just where you’d want to see these indicators if we are about to commence a major bull run.
As always, time will tell.
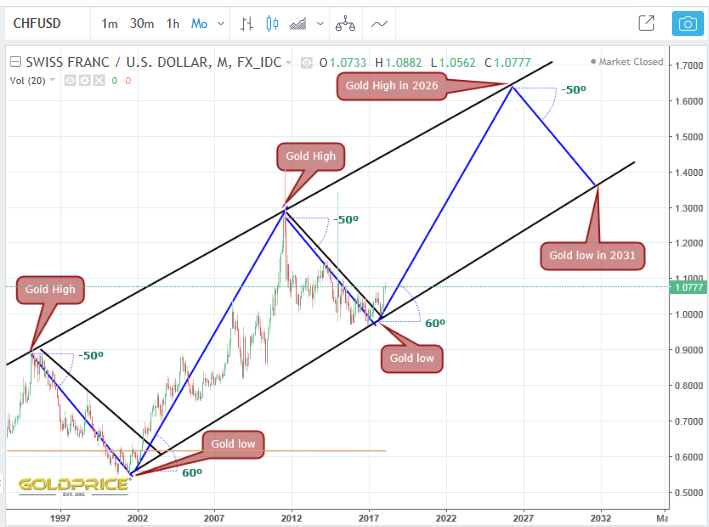
I’ve posted this very important PM indicator a few times. I thought I’d show you an update. We’ve clearly broken out and left the bottom behind us. Applying an angle of ascent consistent with previous cycles takes us to the top rail and therefore the gold top in (drumroll please)…..2026. This ties in perfectly with Spocks expected ‘K Wave Peak’ in 2026.
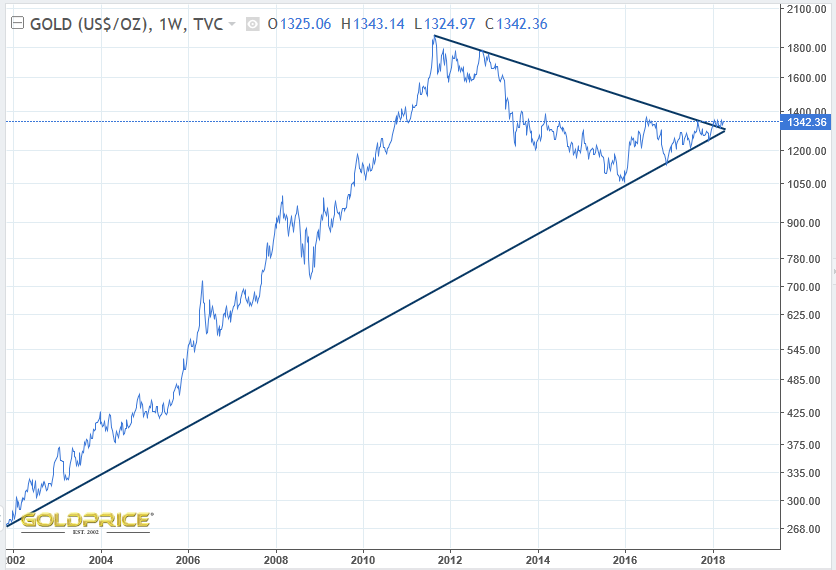
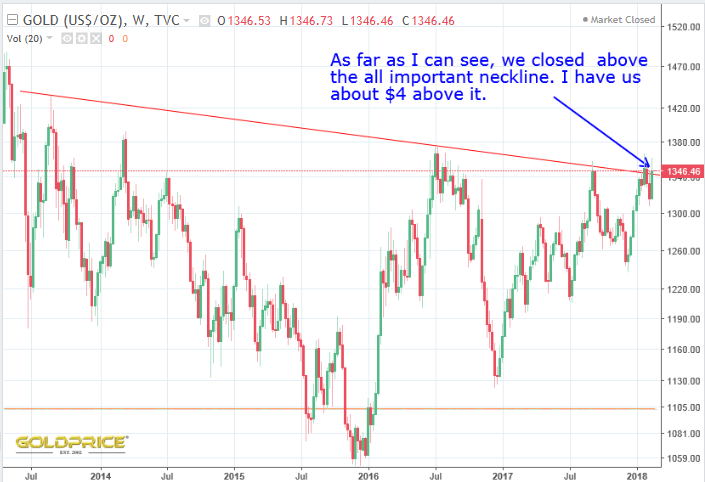
So if we look at the log chart of gold, it looks to me as if we just closed above the neckline. It’s very close, and other scales/software may show us just on, or even below it. The next week or two will tell us all we need to know.
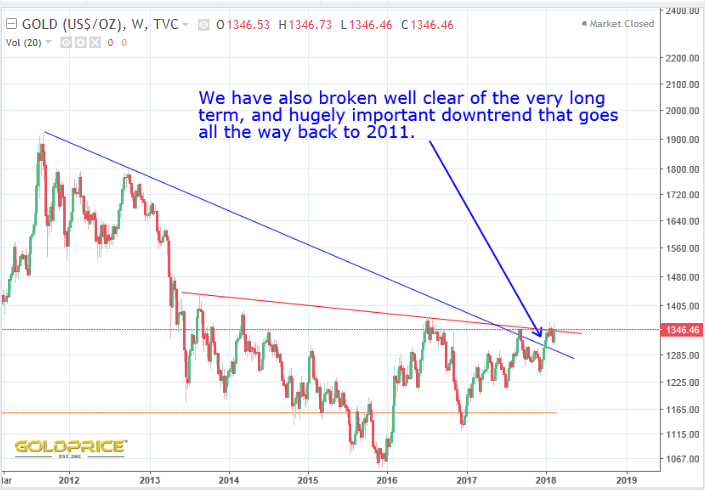
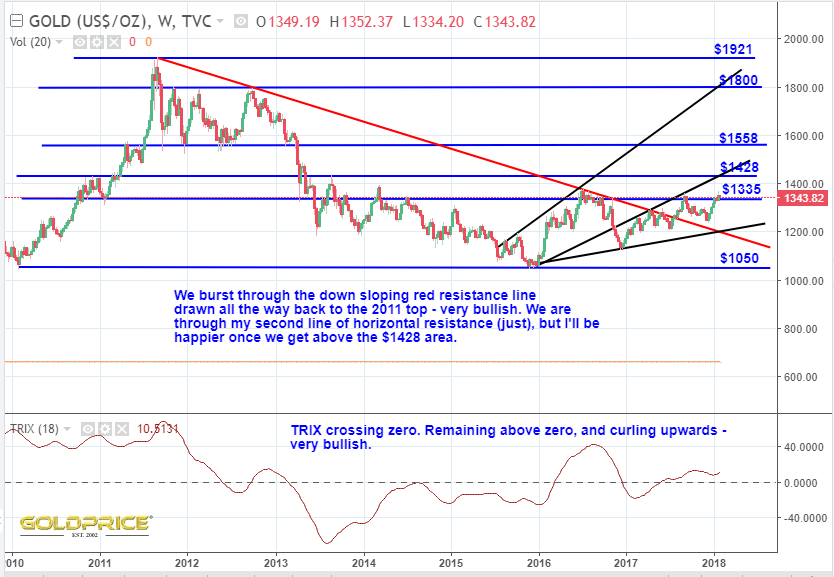
Much clearer though, is the (very bullish) fact that we are now through the long term resistance from the 2011 top.
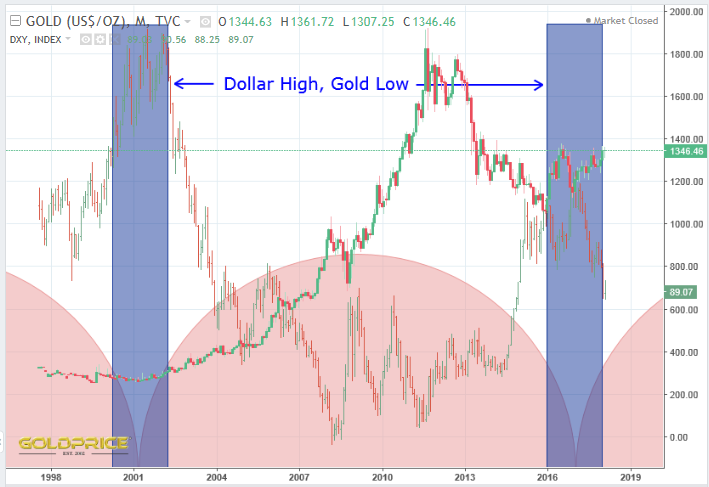
Cycles purists won’t like my next chart, because, I’ve merged the dollar and gold cycles and fiddled about with them a bit, in order to make a more general point. There is a relatively short ‘time zone’ at these cycle lows, where gold finds a low, and the dollar finds it top. As far as this current cycle is concerned, that has just happened. This implies a lower dollar and higher gold going forwards.
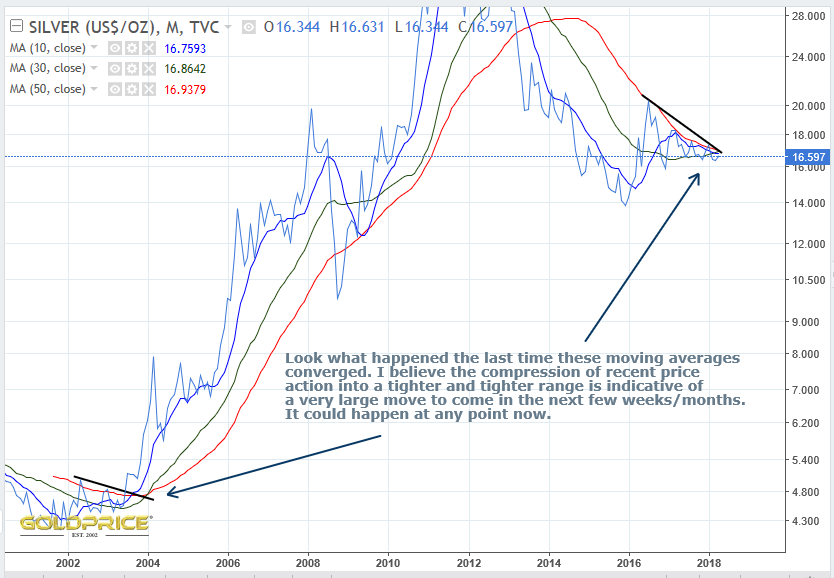
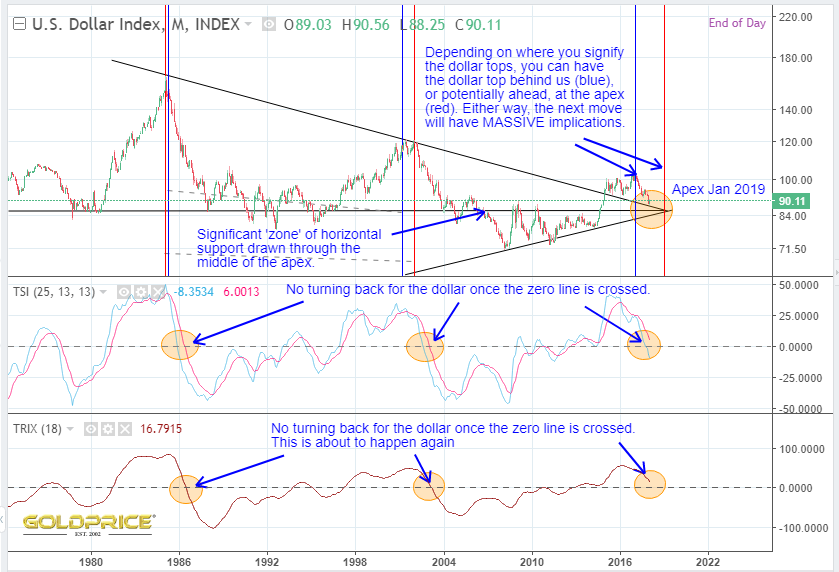
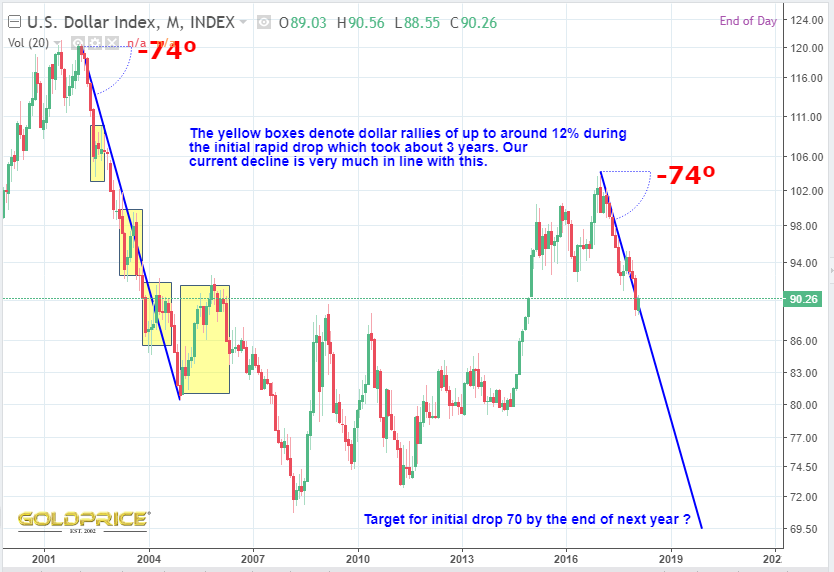
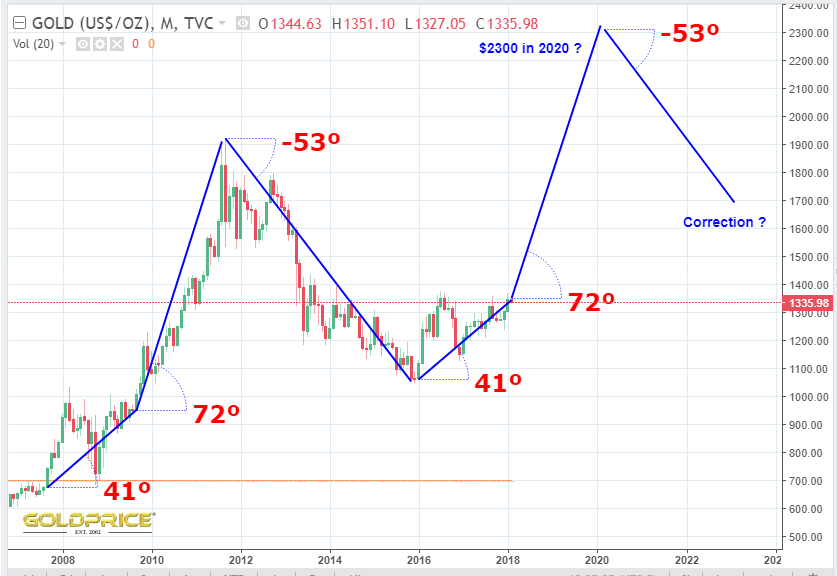
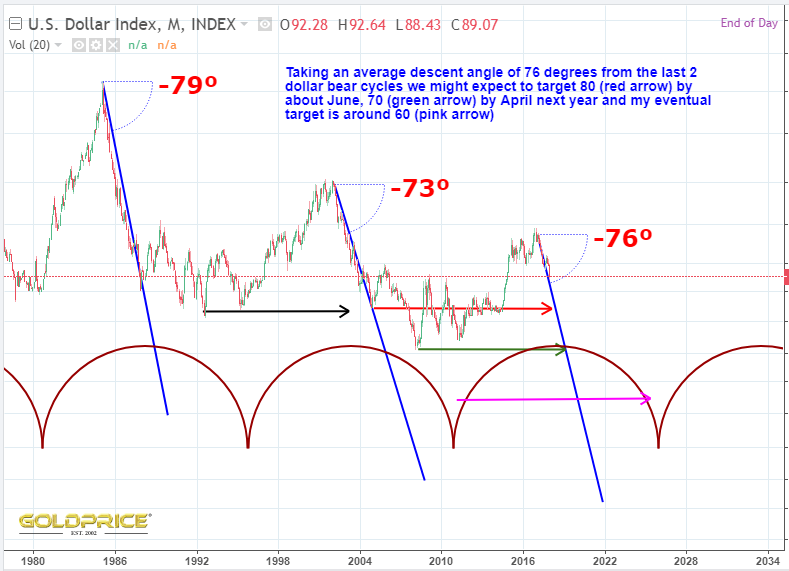
To finish off with, I’ve taken a closer look at the dollar chart, and applied some lessons from the past to see where we’re likely to be going. Fascinating to see how the moving averages behave at the dollar top and how our current position compares to the last 2 dollar cycles. Our timing in the cycle is perfect, the moving averages and TRIX are about to confirm beyond any reasonable doubt that the dollar is in a bear market. Our angle of descent is similar to past occasions and if timings are similar, we should see TRIX bottom in early 2019, taking us to around 65 on the dollar index (where the red descending line finds itself at the TRIX low early next year), followed by choppy action and a final low of 55-60.
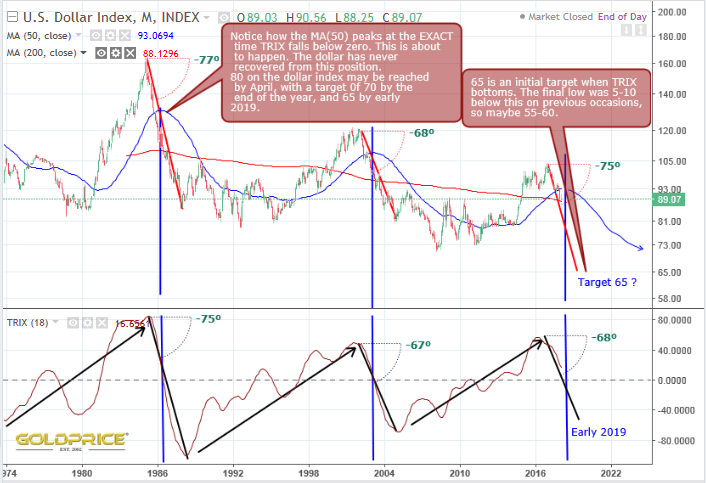
A final comment. The lower highs and lower lows on the dollar index indicate a dying currency. Either we see the trend turn up in the next cycle, or the dollars world reserve status is coming to an end.
From a poster that I’m going to miss, ‘synced moves’ are taking place now. There are several ways of looking at the gold chart. My bullish bias has been entirely down to my acceptance of the relevance of cycle theory. I know Surf is the expert, but I’ve been using forms of cycle theory in my job as a meteorologist since 1987. Pretty much everything on planet Earth that lives or is part of a natural or man made system (plants/animals/weather/climate/global financial markets) has a discernible cycle. To ignore that would be foolish. There is more than one way of viewing the recent price action in gold. Some show that we broke out a while ago, others show that we may be in the process of breaking out now. A few more dollars from here and however you slice it, we will have broken free from a very long term trend line on an absolutely massive wedge. Support currently in the $1220 region (that’s just a rough guide from the chart below).

and if you’re wondering what forces are at work – just look at where we are in the cycle. Examine the now positive and up-trending indicators like TRIX. The bottom red line turned from resistance to support at the start of the last bull run. All these years later and it’s providing important support. The down trending resistance line from the 2011 top has been broken to the upside on the log chart.

And whilst you’re wondering if gold might go to $800, take a look at the dollar chart and explain to me how you could view it as bullish…

If gold goes to $800 and the dollar climbs back to new highs it’ll be completely unprecedented at this point in the respective cycles. We’re fast approaching the point of recognition (as gold reaches the psychologically important $1400 and the dollar sinks to new lows). In my opinion, it’ll be at that point when money starts flowing into the mining sector and we see the mining indices playing catch up.
As an aside, after all the recent unpleasantness, I feel somewhat uncomfortable on this site, and will probably post much less frequently. I’m not wanting the sort of ‘debate’ that took place recently to happen to me. I prefer somewhere where all views and opinions are welcome, as long as they are backed up by charts that make sense and a polite turn of phrase.
But the dollar could rally considerably from here and gold could drop $50-$100. The miners would be left for dead if that happens of course, with many returning to their all time lows. Amazing when you consider that we’d still be looking perfectly healthy and normal on the gold chart. As I’ve said several times, this thing isn’t going to come alive until that neckline is broken to the upside. With rising rates, gathering inflation and a faltering stock market, I firmly believe the stars are aligning for gold. Whether we drop as far as the charts say is possible, I’m not sure, but my sense is that we’ll be clear of $1400 in the next few weeks (by April/May). I still expect to see $1500-$1550 this year.
Cryptos are taking a massive hit, the stock markets had a tough couple of days and the dollar is staging a slight bounce, and as you saw in Graddhys post, bonds and yields are at a turning point (assuming you agree, but of course, you may not). So where does that leave PM’s ? Looking at the chart below, I still think we’re in the time frame for a breakout above the long running resistance line in the next few weeks. Support is down near $1200, so a drop to that level is certainly not out of the question. Those of us holding mining shares would need a change of underwear if happens though. After looking at the HUI chart, I have no idea just how low it would drop, but I don’t want to find out.
As I’ve already said, I have a strong ‘gut’ feeling that the miners aren’t going to get going until we see that clear breakout, with a move north of $1400.
It’s interesting that the angle of ascent from the start of the move to now, is the same as it was when we built out a very similar chart pattern in the 2007-2009 period. That lasted about 2 years as well. Are we about to breakout and see the angle increase like last time ? Depending on the chart and scale you use, the angles are different, but they match (then and now). Anyway, I just find it curious, and can’t see why it would repeat exactly the same, but we’ll see I guess.
Lots of posts and only zero to 2 comments on many of them. Where’s everyone gone ? Perhaps I should turn the lights out
If we assume the bottom red line is going to provide support through to 2026, and use some simple trigonometry, this is what we get…
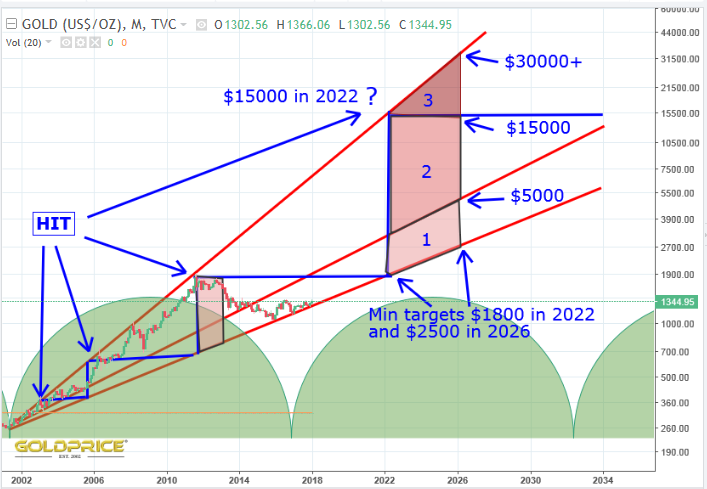
Zone 1 is a dead cert in my view. If we return to the upper red line the numbers seem ridiculous. This is a log chart, so a straight line from bottom left to top right represents an exponential, parabolic move. You can see that in the price action leading to the 2011 top. All speculation of course, but a bit of fun. Alternatively, the dollar moves to new highs and gold plummets to $800.
It’s picture perfect (so far).
Here are a few of many resistance/support lines. I’ve concentrated mainly on horizontal supports, and there is a little give one way or the other when deciding where to place some of them…
The ‘bull trend’ would be maintained, even if we fell all the way back to the lower black line. However, if this is real, as I believe it is, we should see an acceleration of the trend developing.
There’s no getting away from the fact that the miners are much slower off the mark this time around…