The Dollar Has A Heartbeat, But It’s Fading
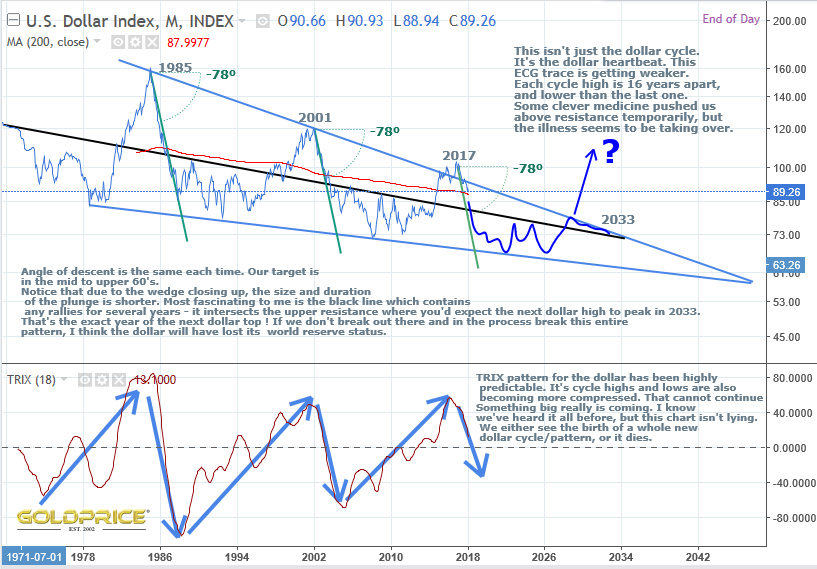
I haven’t seen too many (if any) charts that show clearly how, why and most importantly, when the dollar is going to die. My view – no later than 2033. It appears to me that the dollar will fail during its next cycle. Either the dollar is dead by then, or it will be reborn. The status quo cannot continue (and I’m not talking about the quirky British rock group who had their heyday back in the ’70s).
As I’ve said before, cycles are all around us. Some are relatively stable (for now), like the seasons and the tides. All are terminal though, eventually. What often happens is that a cycle becomes unstable, breaks down, collapses the system, and a new one is reborn out of the ashes. There are too many to mention, but think volcanoes, earthquakes and hurricanes. Pressures build up, a cycle starts and builds towards a massive release of energy and destruction, and the whole thing goes into a quieter phase until the cycle builds again. A human life is also a cycle. Birth, growth, maturity, decay and death.
Now that I’ve cheered you all up, consider the mighty dollar. It certainly isn’t the worlds first reserve currency, so why should it be the last ? There are multiple signs that its dominance is drawing to an end. This is obviously a massive deal for investors. Knowing when this is going to happen puts you one step ahead. I think it’s becoming clear where the power is shifting. The petroyuan is now trading, and gold backed currencies are highly likely in China and Russia – just look at how they’ve been accumulating gold in recent years. If reserve status moves east, the implications for PM’s are beyond anything we’ve seen in the last 100 years. Sounds dramatic doesn’t it ? But just think for a moment…For holders of gold/silver in the west, what do you think will happen to the value of your holdings when measured in your local currency if the dollar loses reserve status and global trade deals are no longer settled in dollars. What would be the implications for US debt/inflation ? That’s a whole different discussion. For now, lets just look at what the chart is telling us, and let it sink in.
Thanks Northstar. Good info. My problem is that every chart I have seen posted on the dollar only goes back to the 1970’s to show its cyclical nature. Was it this predictable before that? Say from the start of the Federal Reserve (1913) until the 1970’s? 2 1/2 cycles is not enough data for me to make a sure fire prediction.
Anyway, thanks for the write up and I would be very interested to see more historical data.
Thanks for the comments Ken, and I wholeheartedly agree. The difficulty we have is that if we go back pre 1970’s we enter a time of the gold standard and the Bretton Woods system. The cycles you see in my chart (this heartbeat) was only able to become established when the ‘market’ decides freely what the dollar value of gold is. Limited data is never a good thing, but I do think there is a strong case here. We’ll know soon enough, because, if I’m right the dollar is going to fall as per my chart above, rather than rise back above 95 or 100.
Very eloquent Sir Northstar.
Thanks for reminding me I’m in the decay process
Lol, maybe ‘extra-mature’ or ‘over-ripe’ might better ?
Sir Northstar, from some of my outside reading the dollar will indeed be replaced by SDR’s, special drawning rights which supposedly will allow the transition of the dollar out of the reserve currency status without blowing everything up. Having said that, I think gold will have its placed at the table no matter what happens. Thanks for the great post above.