Dollar Schmollar – Who Cares ?

It’s interesting to ponder the Dollar. Will it go up ? Will it go down ? It’s true that a rapidly falling Dollar can assist the ‘apparent’ increase in Golds value BUT it’s way more complicated than that. If the Dollar was heading towards a cycle peak, it MIGHT prevent gold from taking off in a big way. That’s about all we need to know, because in every other situation gold rises and falls regardless of what the Dollar is doing. PM’s frequently couldn’t give a rats ass what the Dollar is doing, so we really don’t need to worry so much. Take a look at this if you’re not sure…

Too many Lines ?

Perhaps I got carried away 🙂 The big picture…

Possible PM Bull Move Ahead

The following charts would of course be negated if/when any of the support lines are broken to the downside. Following the Feds clear policy error(s), I think the odds are weighted in favour of a PM bull market gathering steam. I’ve been saying for some time now that nothing is proven until we break through the $1350-$1400 region. A little more consolidation beneath that level won’t do any harm at all. I drew the silver chart with a similar rounded base to gold and wondered why it seemed so much longer in time before it might reach completion and breakout. However, the ‘basing’ seems to have been ’tilted’. the curve fits perfectly if you tilt it, and then it matches very well with the declining resistance forming the breakout level. I’ve included both of my silver charts below. For gold the important breakout level seems to be through horizontal resistance, whilst for silver, it’s through a declining, angled resistance line. It’ll be interesting to see how gold stock react – they have a hell of a lot of catching up to do. Here are the charts…

Inflexion Point

I’ve posted a chart in the past that shows clearly gold can go up or down when interest rates are rising. It can go up or down when rates are falling. It’s less about the direction rates are going and more about expectations. If rates are rising, and everyone is confident that it’s a good thing and it’s going to achieve its aim – perfect, what’s the problem ? If rates are rising as some sort of panic measure, that’s different. How about where we find ourselves today ? As a reminder, this is what we were told to expect less than 12 months ago…


A path beyond 3%. Many have been warning for a very long time that it can’t happen for one simple reason. DEBT. It doesn’t matter until it does. Well, we’re there now – IT DOES MATTER. All of a sudden, just like that, everyone knows it. We’ve reached the point where rates can rise no more. The US would collapse under its own debt burdon. So there you have it. The Emperor has no clothes, The Fed has no bullets. The Dollar will suffer badly as a result, and gold will fly (the miners will mean-revert). All my own views of course, and you may disagree, but I suggest the facts speak for themselves.

Remember – HUI Has Broken Out

This chart remains very bullish, and suggests the miners could be preparing for a large move…

Sandstorm Gold

Time to consolidate above support ?

Gold In Other Currencies

Summed up by the World Currency Unit…

In A Nutshell

Visualising 3 possible scenarios. Fiddled around with the moving average. MA(20) on this monthly chart seems to fit pretty well, acting as support and resistance at key points. Anyway, you can see the nice breakouts on the way up (through the black resistance lines). The cyclical lows are clear and very obvious. The next one is due in 2023. Three options (obvious really). How do we move into the 2023 low ? Option 1 – This 6 year base does what it’s meant to as the Dollar index finally roll over, giving the added ‘push’ to get us up and through that crucial $1400. If that happens, I think we’ll climb to between $1550 and $1650 (maybe a little more) before correcting into 2023. Option 2 – Sideways, rangebound, tedious. Option 3 – The base and support fail, leading top a waterfall decline and new lows as we go into 2023.

I’ve posted many charts to support Option 1, but I have to acknowledge the alternatives. My assessment is Option 1 – 80%, Option 2 – 10%, Option 3 – 10%. The odds will change if/when we see that $1350-$1400 region breakout, or support failure (which is in the $1240-$1260 region and rising each week). There is also rising (VITAL) support from 2001, which is closer to $1200.

Still Watching And Waiting

Dollar Rolling Over ?

We need to see how it closes out the week of course, but we might be seeing the first signs of a more significant move. That support line is the one to watch though. We’re pretty much sitting on it right now. The close on Friday will make things much clearer.

Looks Moderately Bullish

Does This Chart Keep You Awake At Night ?


Well, maybe that would be a bit extreme, but I just thought I’d explain why I don’t think it’s anything to worry about.

For those of you who don’t think the Dollar Cycle is likely to repeat, this won’t help. However, this is my explanation. Look at 1988 on the chart above. Here it is zoomed in…

Now lets compare that with where we are today…

Remarkable similarities, I think you’ll agree, but here’s the thing. Just as gold looked ready to make a bullish launch in 1988, it flopped, and fell 50% in 10 years. That’s 10 long years of losses for anyone who held on. Why ? Cycles. They all run alongside each other, intricately connected. Supply/demand plays a part, but large fluctuations in the currency index will play a huge part, especially if it were to rise by 50% for example. Which brings us to the Dollar Index. Cutting to the chase – where were we in the Dollar Cycle in 1988 and where are we now ?

Two chart patterns – 1980’s and today. Both look very similar. Both look bullish. One couldn’t achieve it’s potential, the other can.

All Systems Go ?

or both patterns fail and we probably will fall below $1000

Dollar & Gold Since The 1970’s

Since the gold standard was removed, and things re-adjusted in the 1970’s, it’s very clear to see what has happened. There is probably no need to make it any more complicated. Just 2 charts is all you need.

Gold Lease Rates

Another interesting one scraped from Twitter.

Dollar Chart

Dollar declining channel, cyclical channel breakout, sine-wave cycle representation, significant target area drawn from the cyclical lows. Quite a busy, messy chart by my standards, but it does suggest a Dollar low in 2024 somewhere in the mid 60’s. Thoughts ?

Stock Market & Gold

Take a look at the chart below and tell me why the general stock market and gold can’t rise together…

During the most exciting run up in gold prices, peaking at over $1900 an ounce what was the stock market doing ? So it seems a rising stock market is what we need !

Dollar Topping ?

Maybe, maybe not, but here’s a possibility…

Dream Time

Gold – Down And Out ?

Down to between $1240 and $1250, then blast out and above $1400. Looks highly likely to me.

Energy Fuels About To Pop ?

Was That It ?

Maybe Surf and others can give their views, but I’m wondering if that was golds ICL. Credit to @TraderGab on Twitter, for spotting the new channel (I’d like to think I would’ve stuck some lines on and found it eventually, lol). No doubt other are onto it as well. It does give us a nice, clean up trending channel, with parallel lines. The interesting part is that it carries us up into overhead resistance imminently, supported by some very well positioned indicators. Look at the MACD curling up – exactly what you want to see if we’re going to make a charge through resistance. This is starting to get very interesting again.

Silver Similarities

Great chart from Twitter

My Last Dollar Chart For Now

The definition of a bear market, at it’s simplest – lower highs and lower lows. In other words – an ongoing down trend. Since the 1970’s that’s exactly what we’ve had from the Dollar. Every reserve currency decays and loses it’s reserve status. The dollar is no different.

Something Else Is Ready To Explode

Dollar Decay

https://www.zerohedge.com/news/2019-01-02/de-dollarization-spreads-why-these-5-nations-are-backing-away-buck

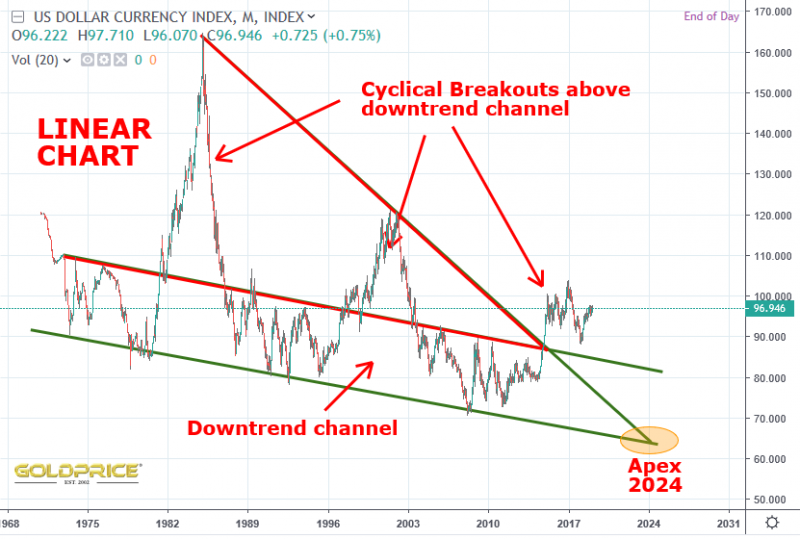
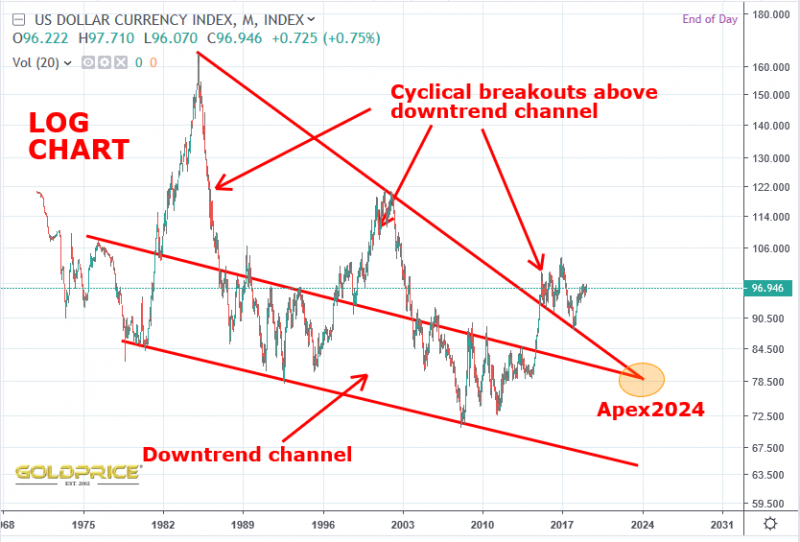
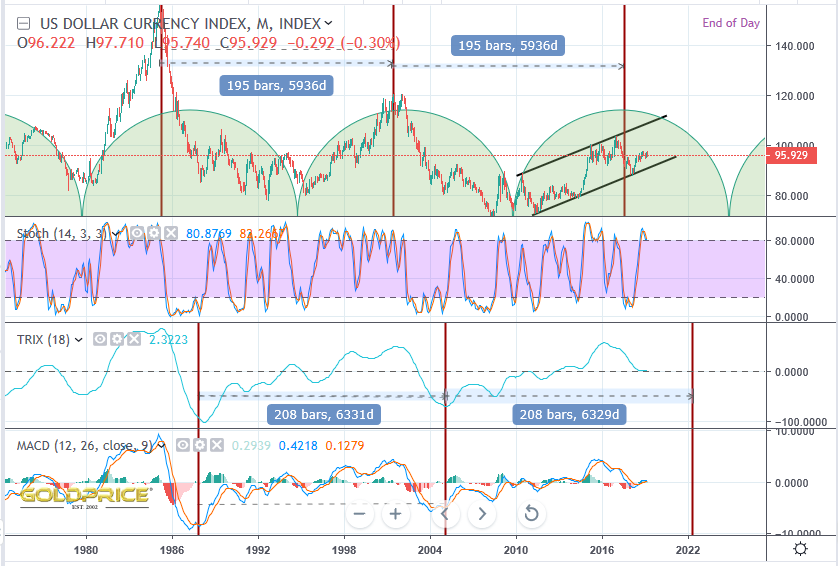
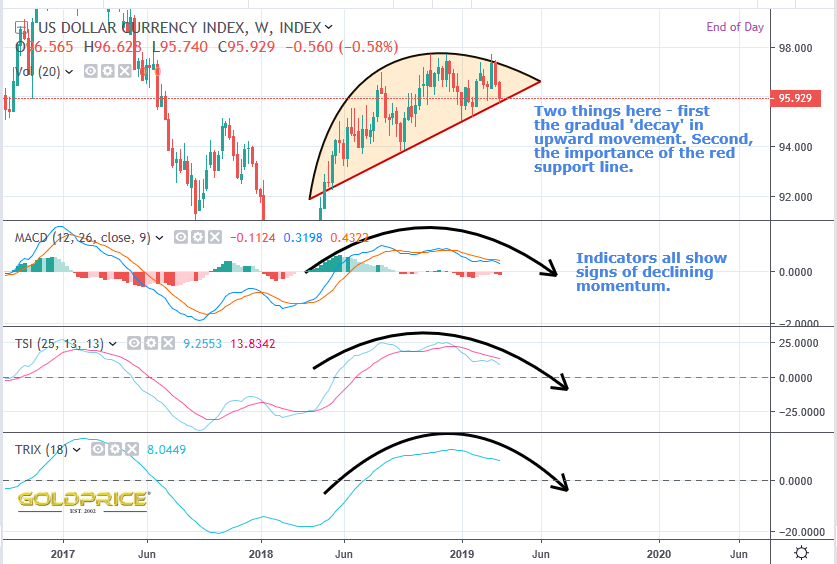
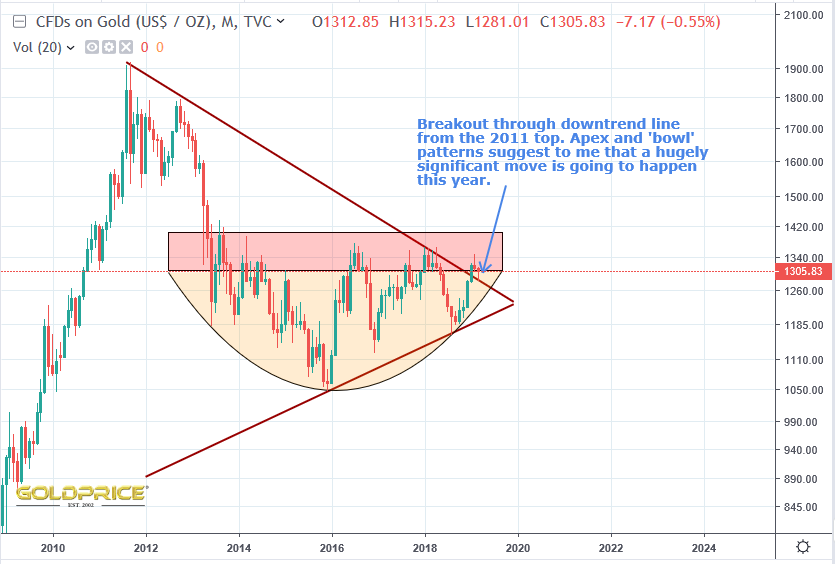
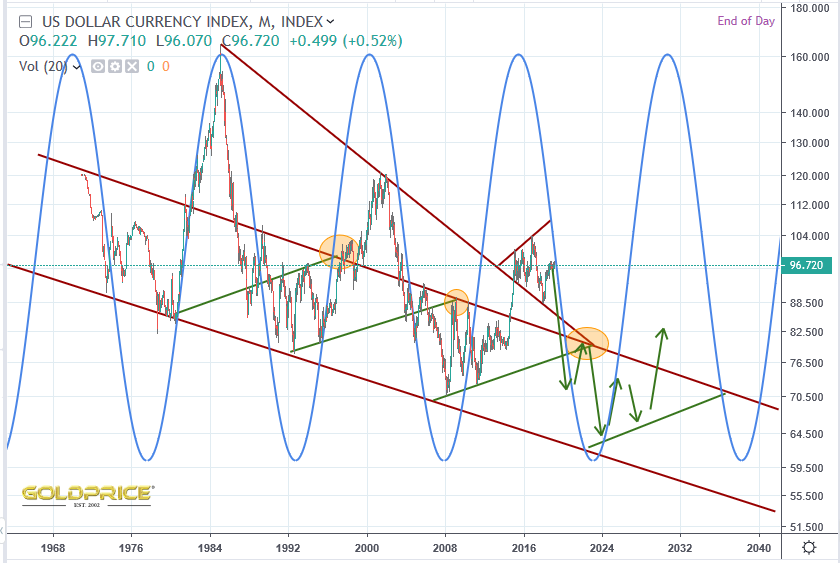
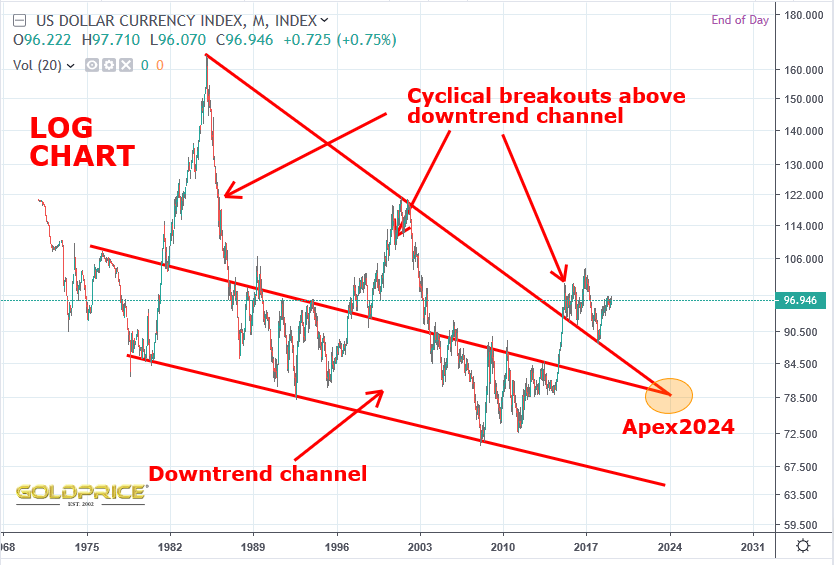
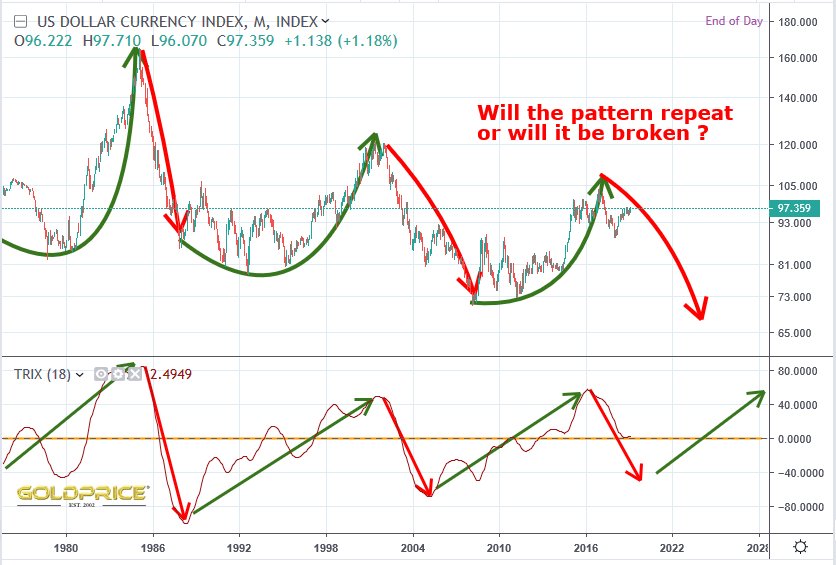
Notice how DXY broke out on the linear chart where the upper downtrend channel resistance was broken, forming an apex with the declining resistance from the 1984 high.

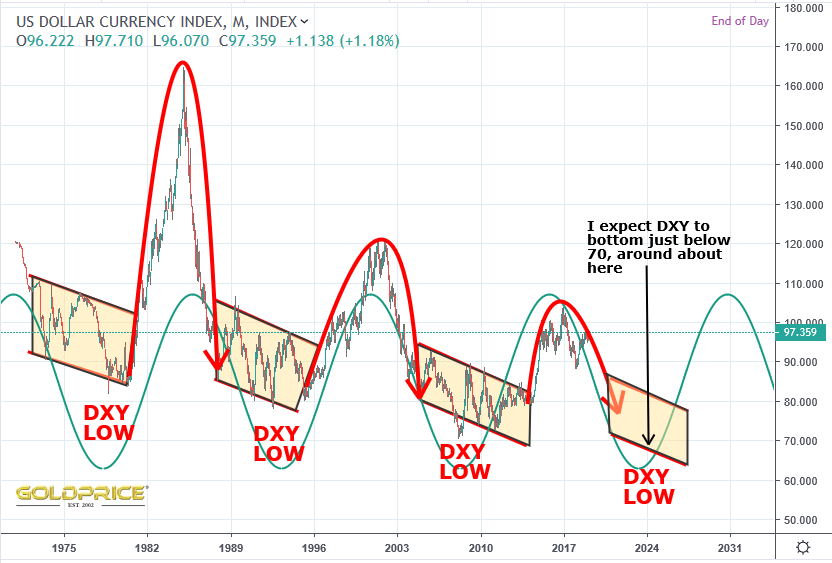
Notice how DXY apex on the linear chart with the 1984 declining resistance, turned support now forms an apex in 2024.

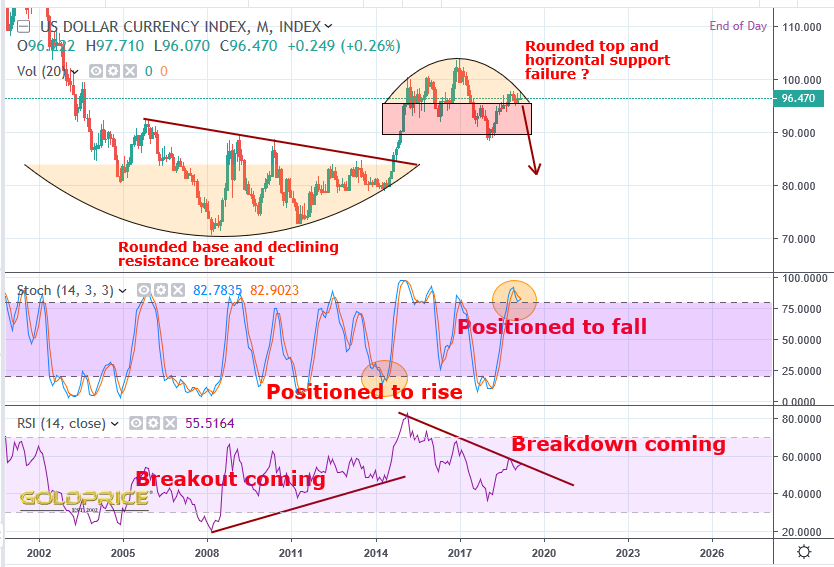
Next, look at the log chart – the upper downtrend channel line also forms an apex with the declining resistance turned support from 1984. In 2024.

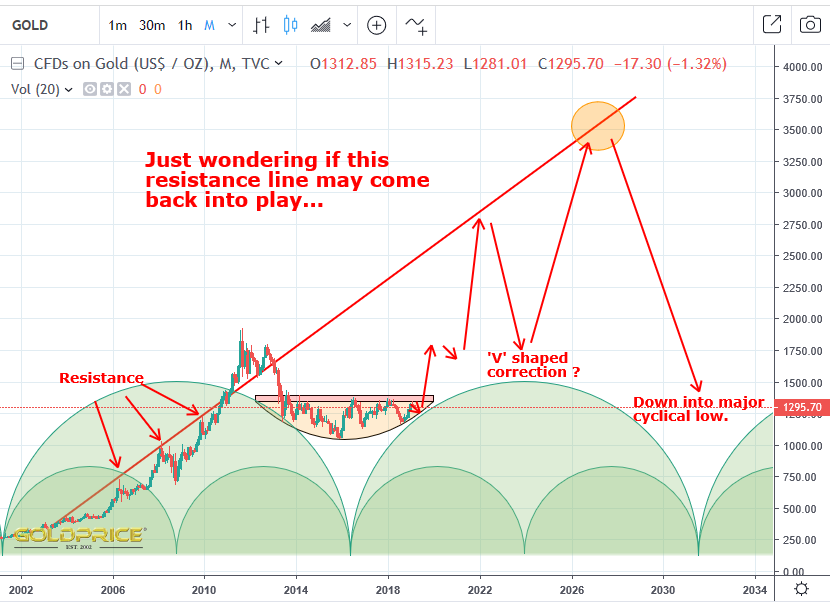
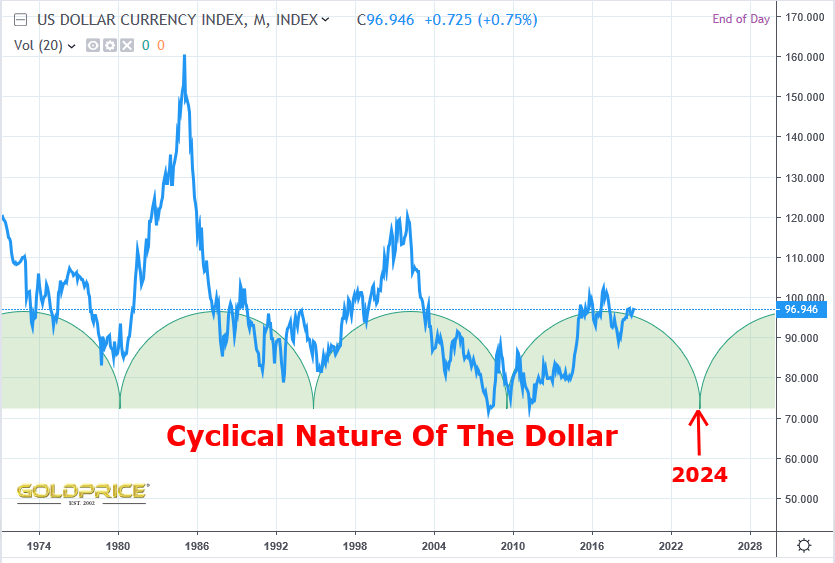
Why 2024 ? It’s simple – that’s the next cyclical low…


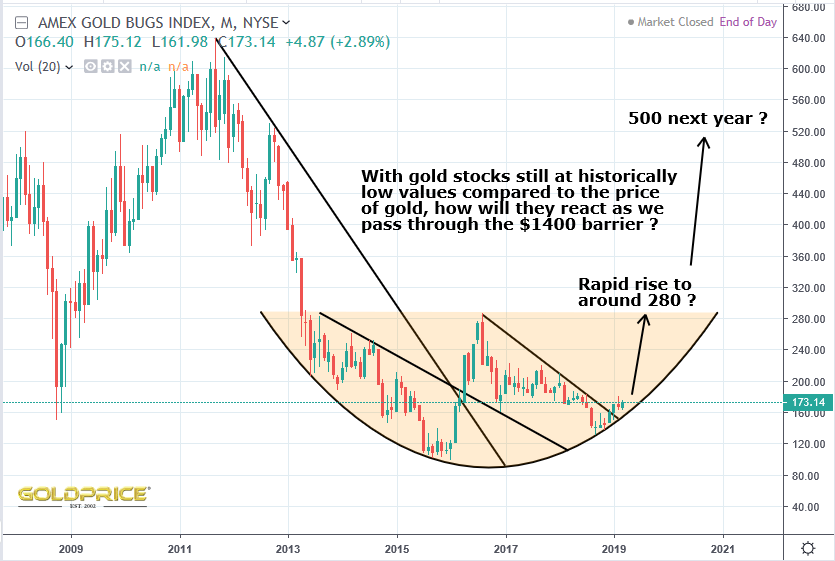
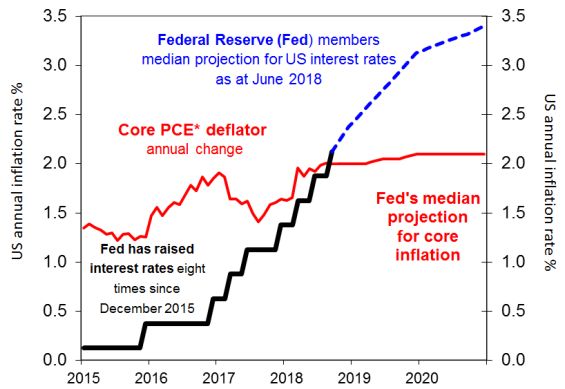
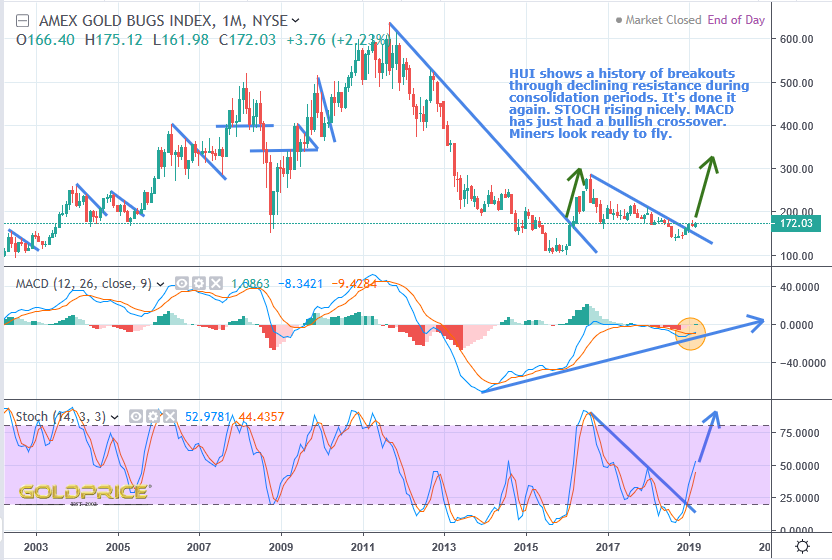
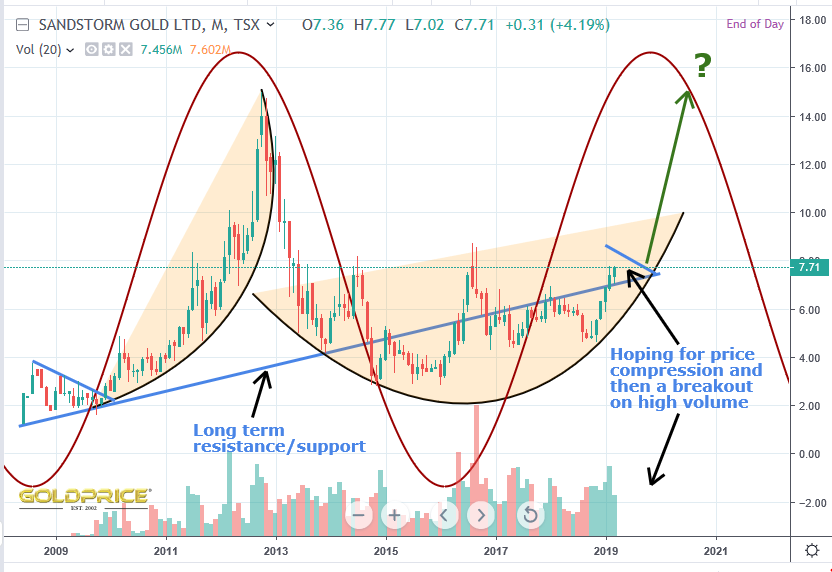
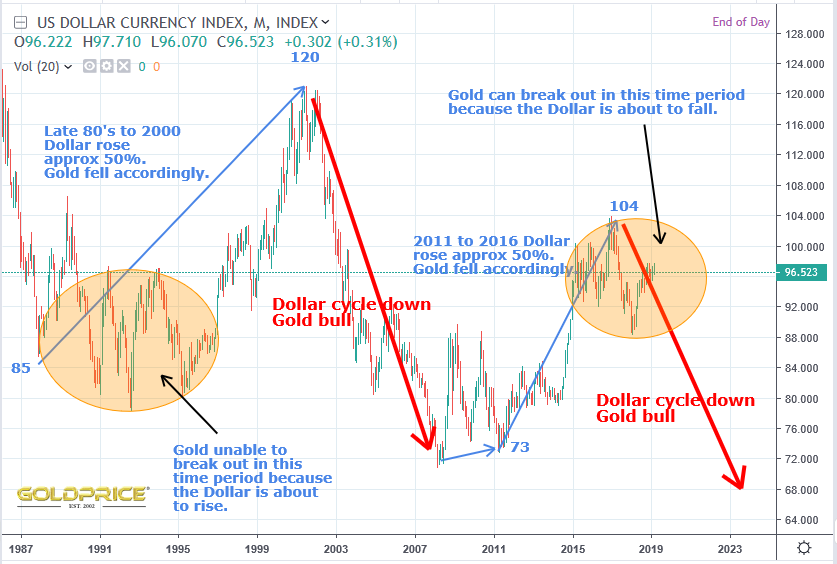
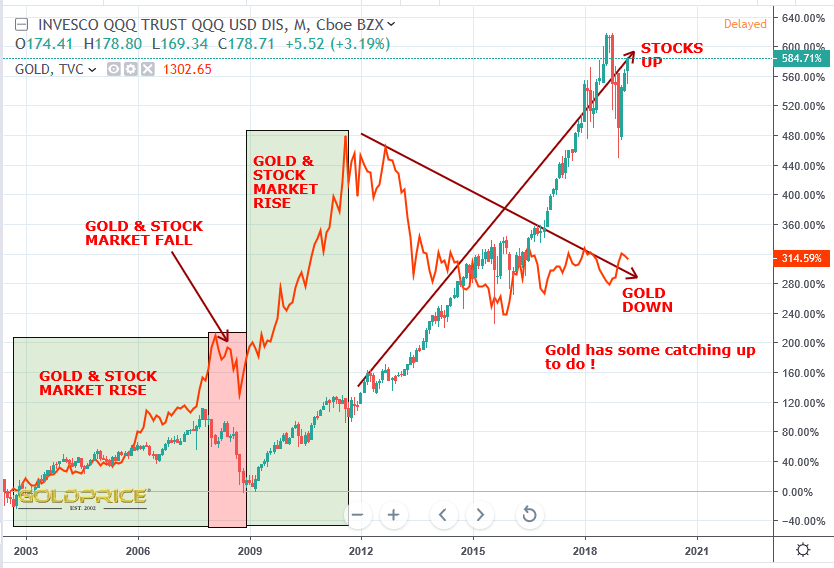
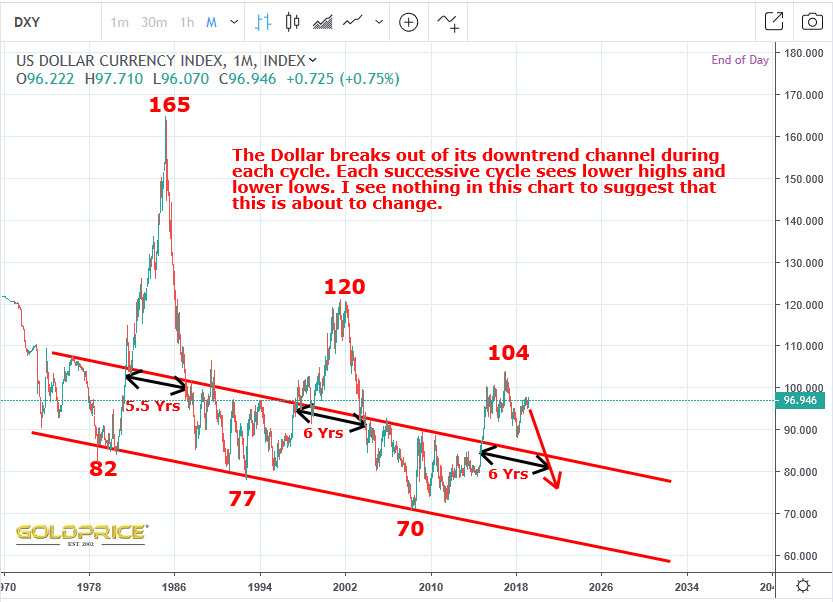
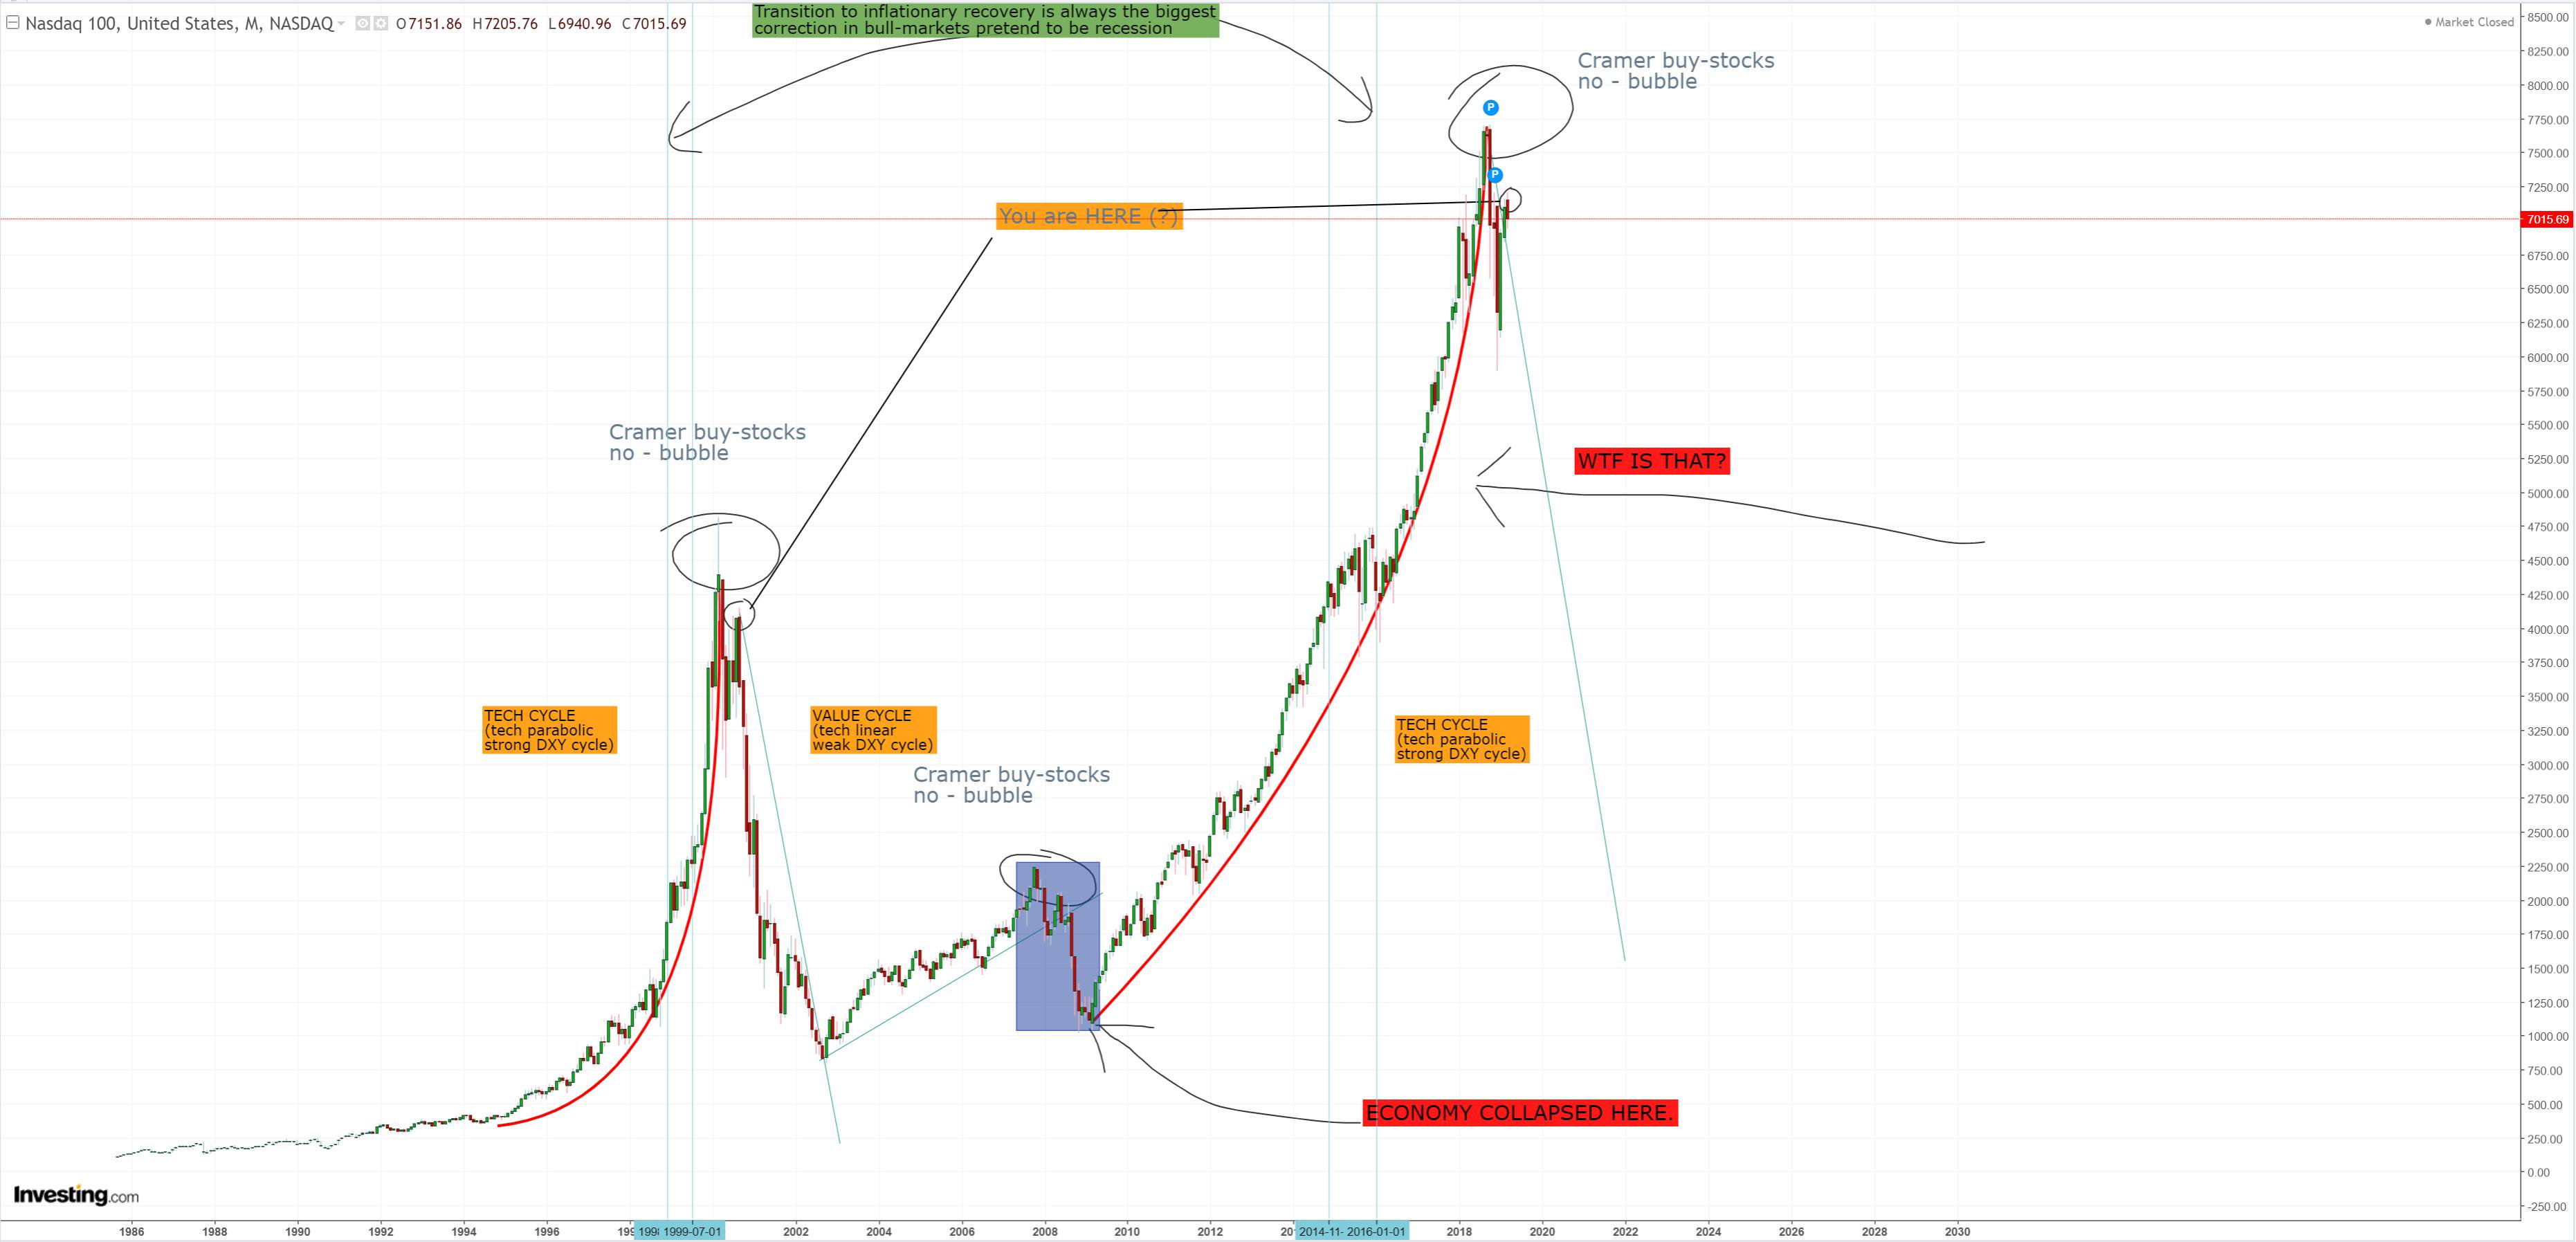
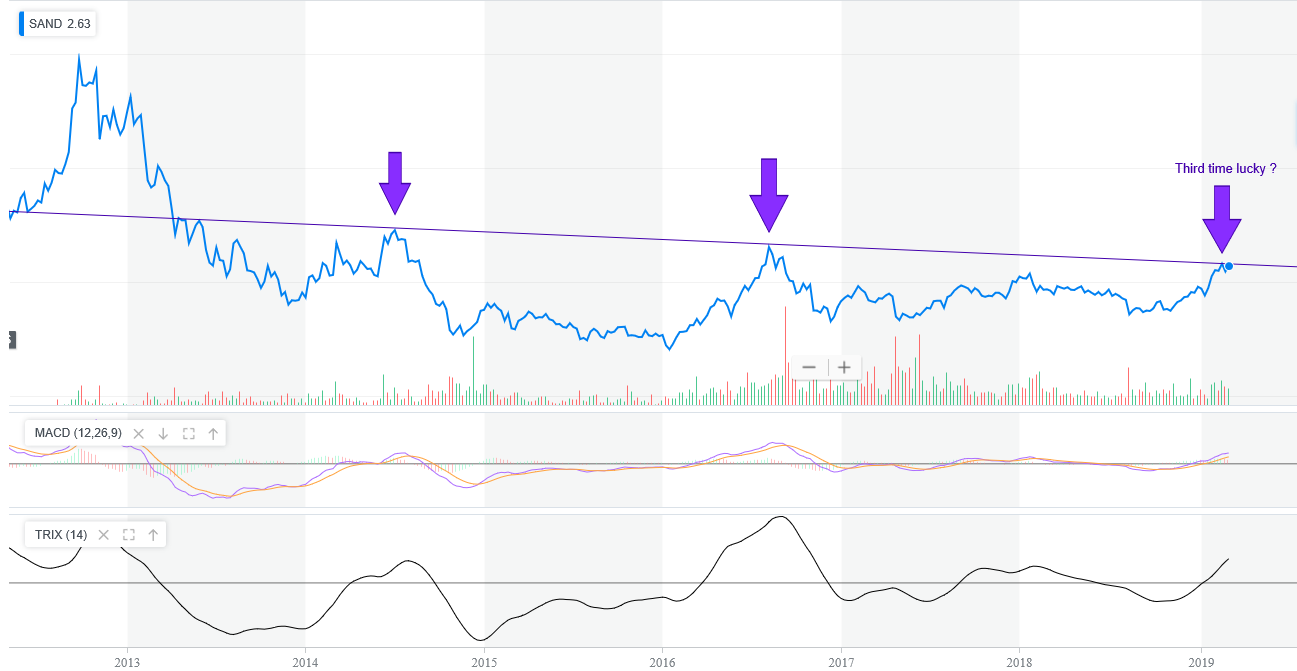
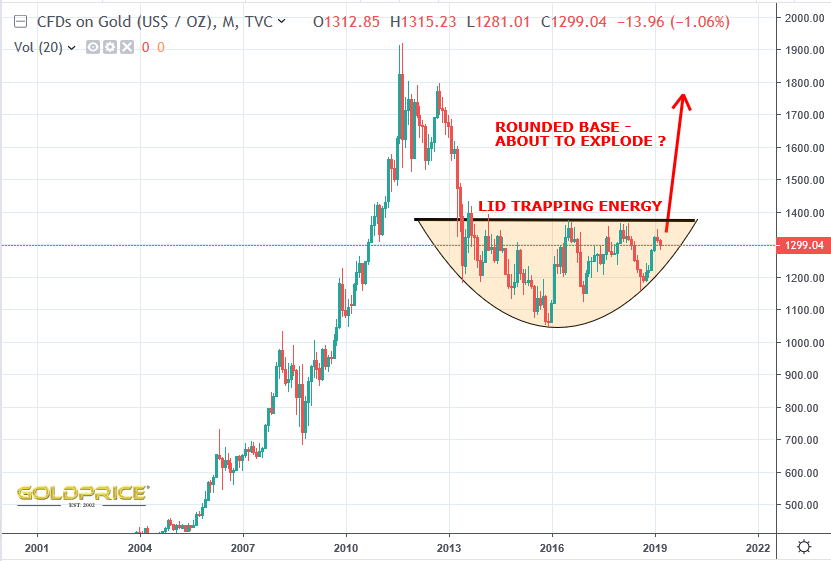
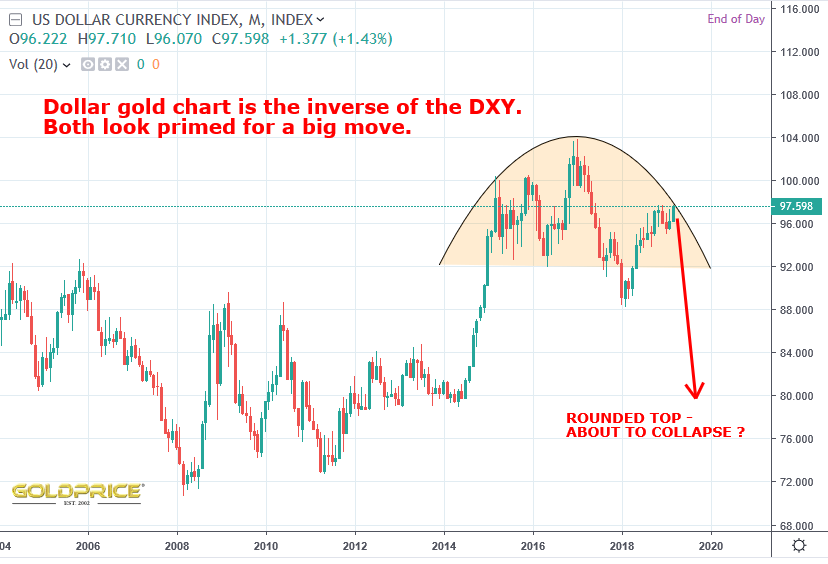
Could this pattern be blown out of the water ? Could the dollar soar, despite declining global significance ? Could it break out to 100, 120, 150 ? Anything is possible I suppose, but it’s just not how I’m reading the charts. With huge interest payments on 22 trillion debt, and one of the worlds worst debt to GDP ratios, things don’t look good for the Fed. Stock markets (in my view) are on the verge of a 50% correction, maybe more, at a time when it’s becoming clear that the FED has very little firepower left. This hiking cycle has maxed out (or is very close) at a pathetically low level. Leaving limited room to react in a crisis. Gold and the miners could collapse further, but after a protracted bear market and (apparent) basing process, I think we’re positioned for a PM bull market. In 6 to 12 months time I could be eating my words, and I’ll be the first to admit I read it wrong. It’s all open to personal interpretation and bias. Good luck to everyone on this forum – I hope we’re all able to benefit from the shared knowledge on here 😉
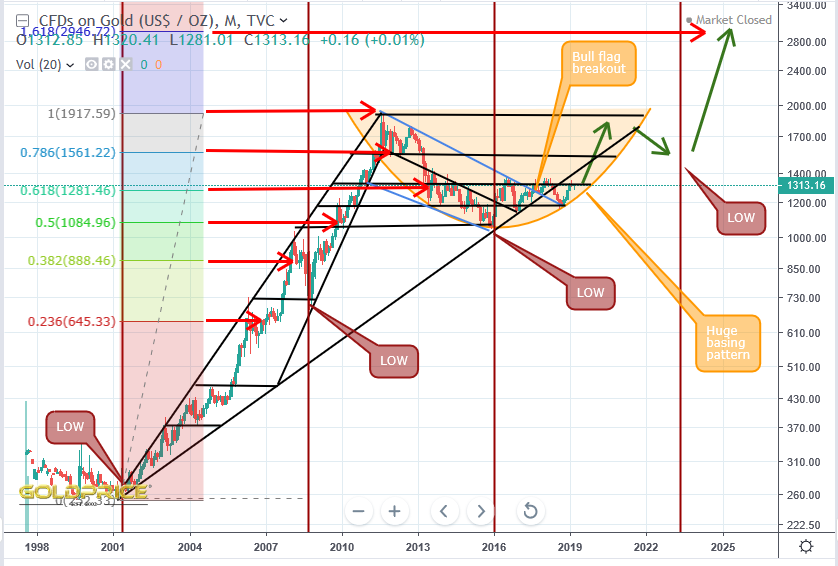
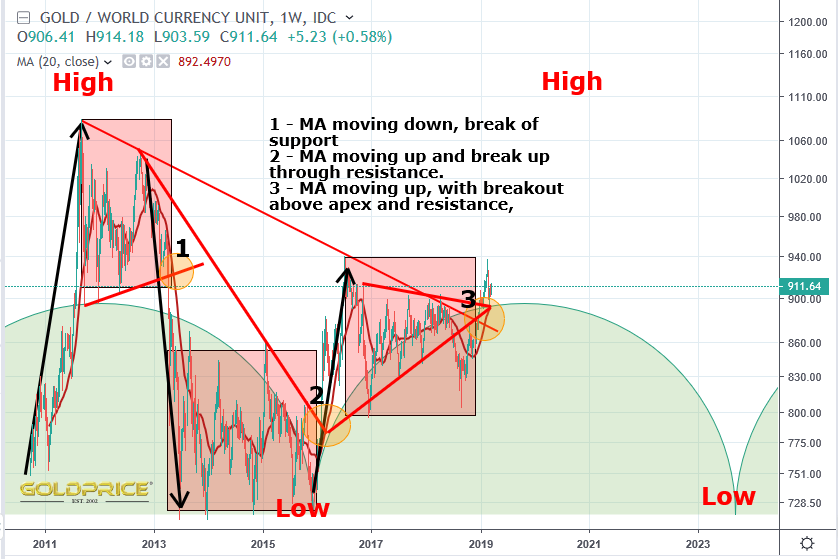
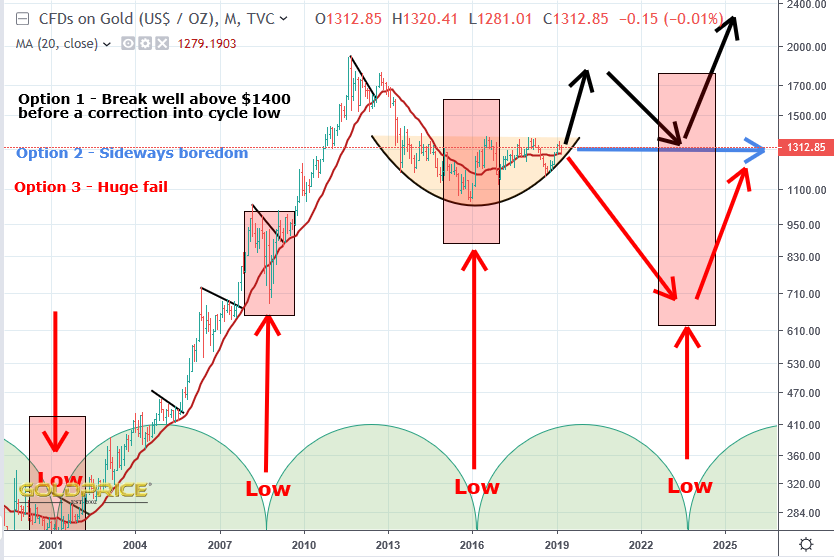
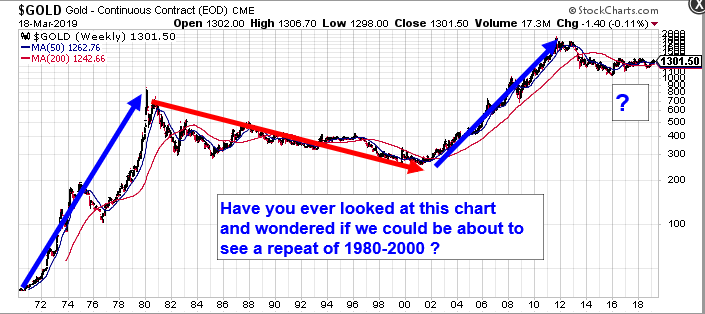
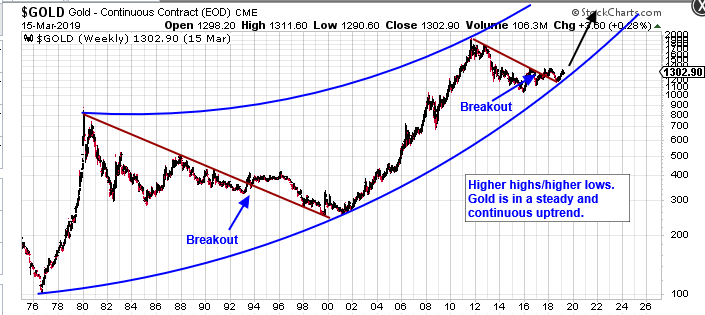
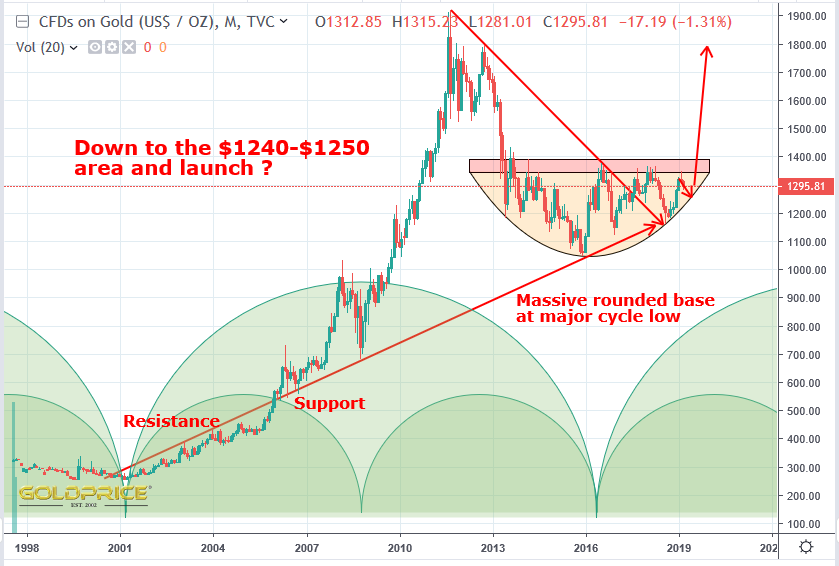
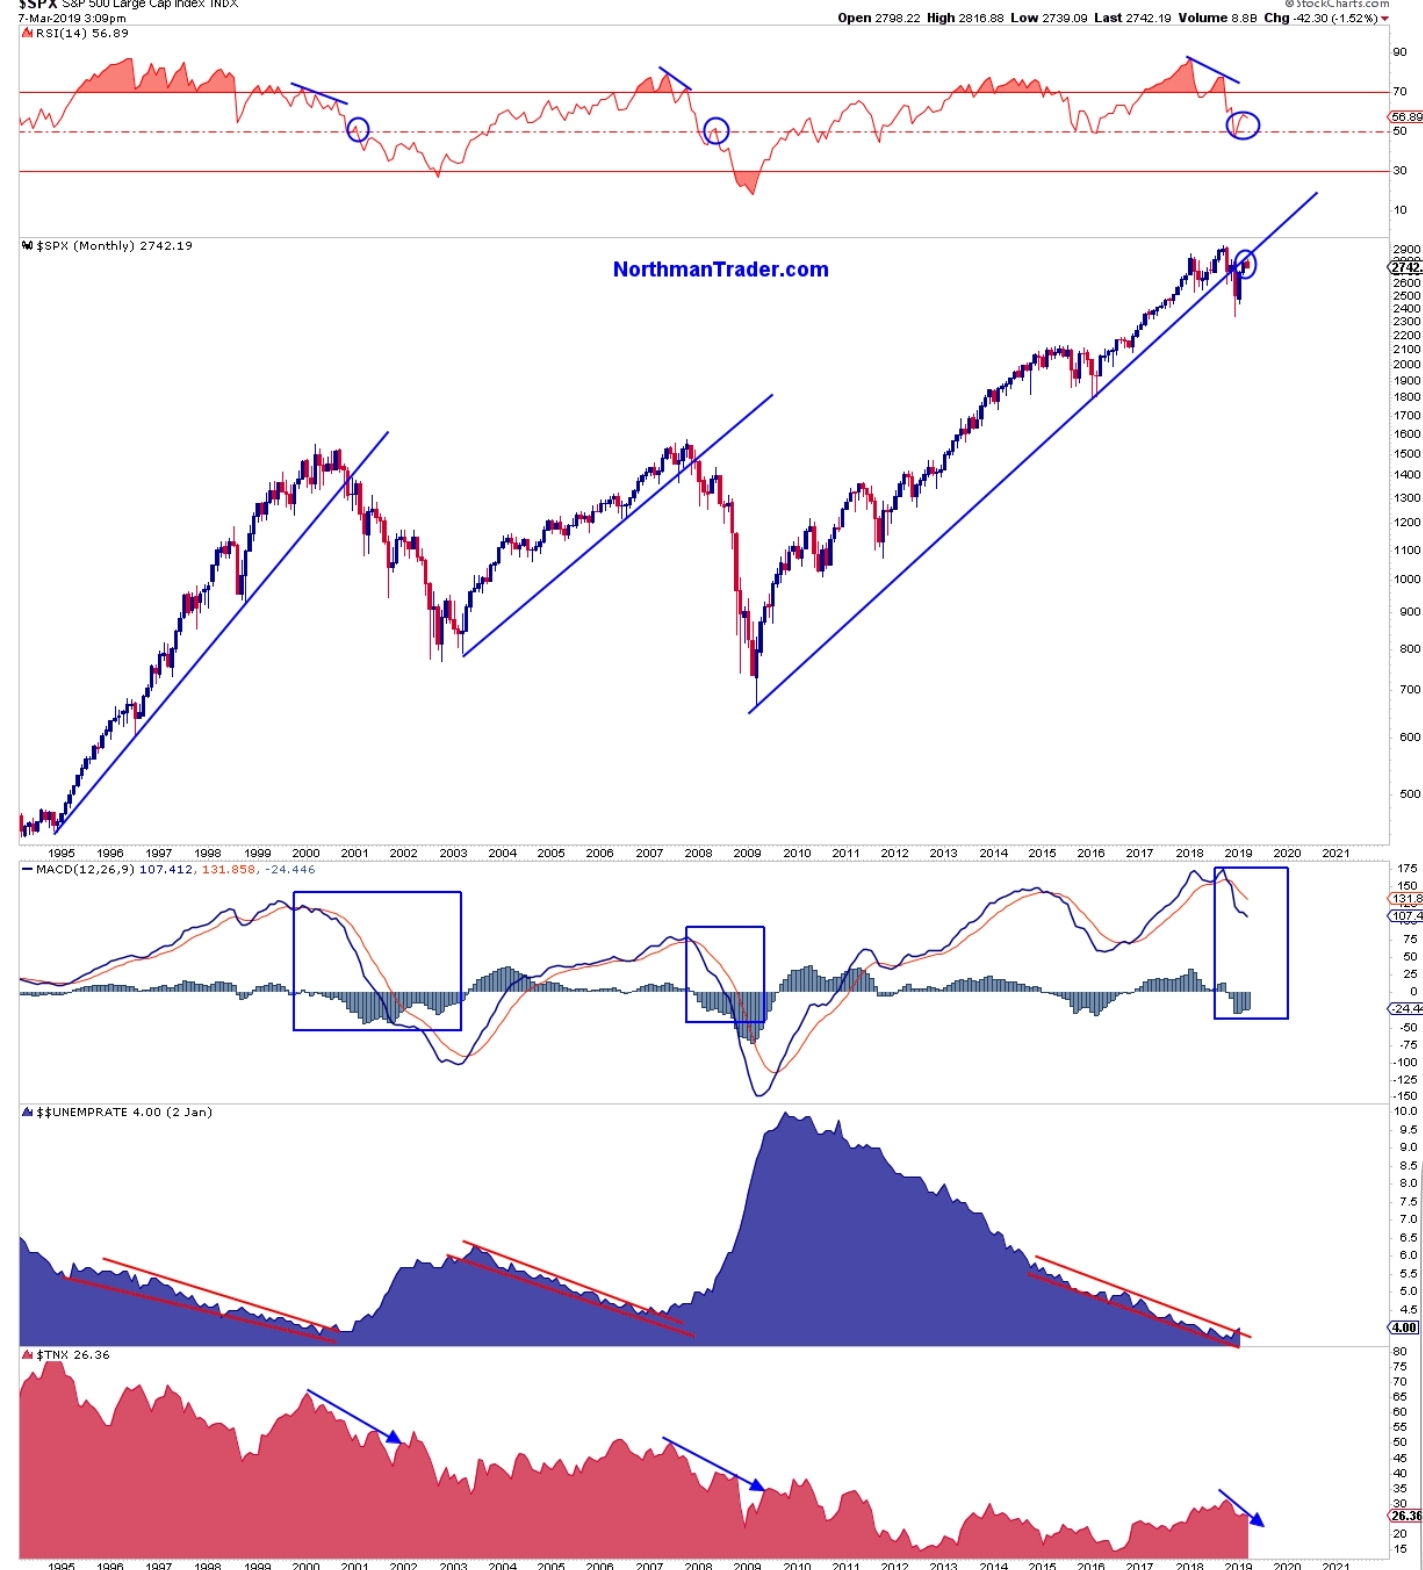
Dollar Bearish View

That’s how I see it. The dollar cycle bottoms in the mid 2020’s and gold should peak a couple of years later. It would be nice to have a crystal ball 🙂


Stocks

Saw this on Twitter from GregTheAnalyst. Thought it worth sharing.

Quality First ?

I’d expect the breakouts to start with quality names like this one first. Sandstorm is getting very close. Will it be beaten back again ?

SPX

Credit to Sven Henrich on Twitter…

Is It Just Me

or is this looking like something big is coming ? I could be wrong. Gold could collapse and the dollar could soar, but I’m putting my money on reverse symmetry moves for both.

Silver On The Move

If and when we get a ‘reverse symmetry’ blast through resistance in gold (through the $1350-$1400 region), it’s likely (if it’s the real deal) that silver will lead the charge, with miners taking off very rapidly. I’d like to see silver make much bigger percentage gains than gold. That will give me the confidence to say our wait is finally over. With that in mind, todays action is interesting.