Possible PM Bull Move Ahead
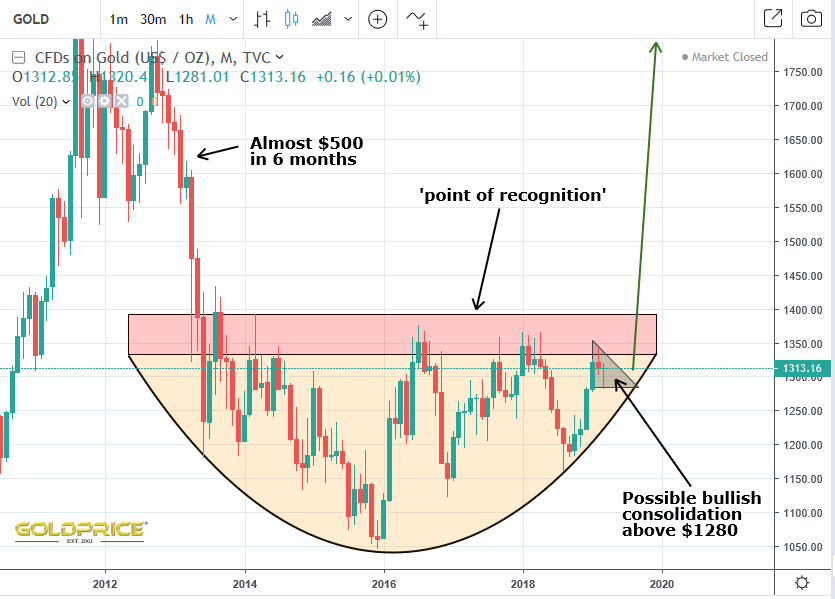
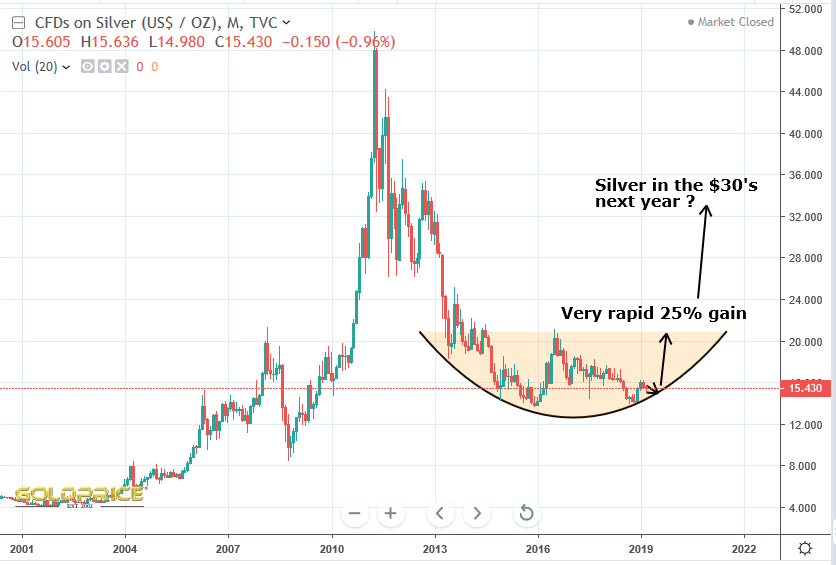
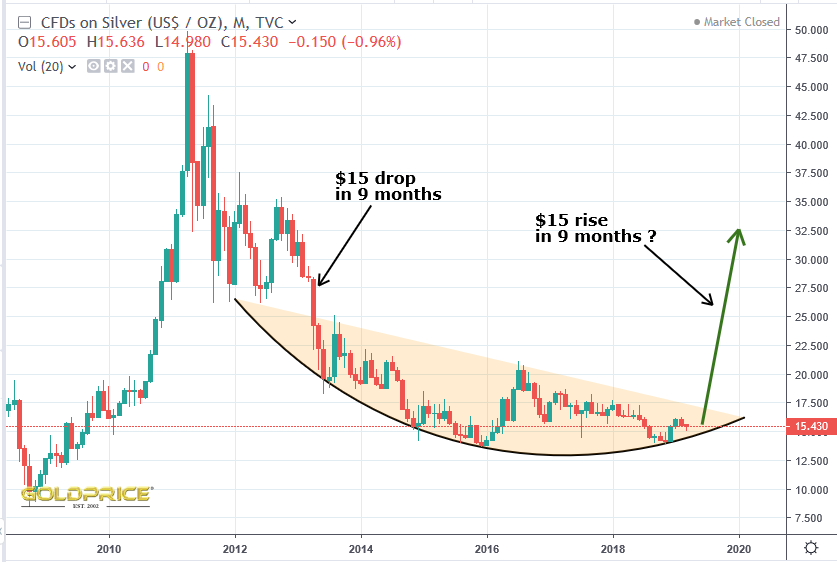
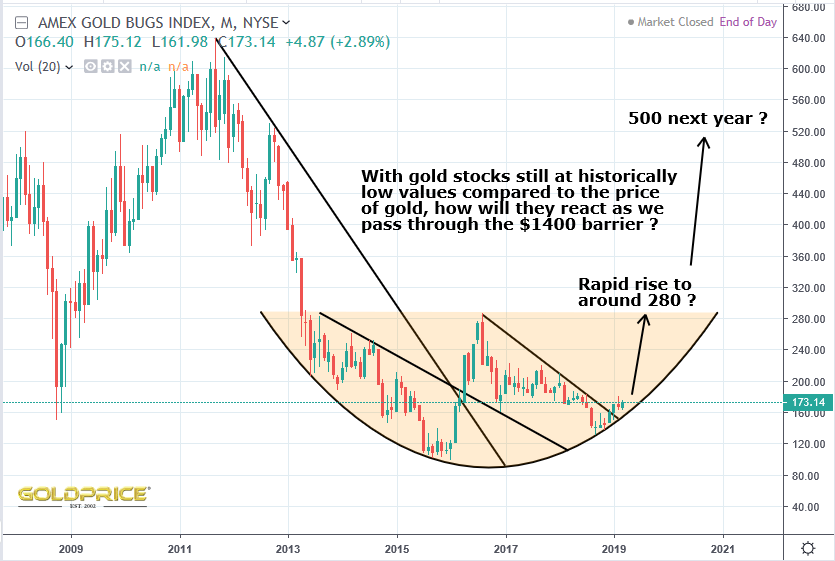
The following charts would of course be negated if/when any of the support lines are broken to the downside. Following the Feds clear policy error(s), I think the odds are weighted in favour of a PM bull market gathering steam. I’ve been saying for some time now that nothing is proven until we break through the $1350-$1400 region. A little more consolidation beneath that level won’t do any harm at all. I drew the silver chart with a similar rounded base to gold and wondered why it seemed so much longer in time before it might reach completion and breakout. However, the ‘basing’ seems to have been ’tilted’. the curve fits perfectly if you tilt it, and then it matches very well with the declining resistance forming the breakout level. I’ve included both of my silver charts below. For gold the important breakout level seems to be through horizontal resistance, whilst for silver, it’s through a declining, angled resistance line. It’ll be interesting to see how gold stock react – they have a hell of a lot of catching up to do. Here are the charts…
Hi Northstar … I find your first picture intriguing and aligning with how the past two large breakouts in gold occurred in the early 2000s and during the financial crisis … coiled triangle breakouts … that may be what’s happening again … see Ty Martin’s post here: https://twitter.com/MarTycharts/status/1109600285985591298
Thanks Afasilver. Some form of bull flag or triangle below resistance would be the perfect set up. We do have enough time for that to happen.