In A Nutshell
Visualising 3 possible scenarios. Fiddled around with the moving average. MA(20) on this monthly chart seems to fit pretty well, acting as support and resistance at key points. Anyway, you can see the nice breakouts on the way up (through the black resistance lines). The cyclical lows are clear and very obvious. The next one is due in 2023. Three options (obvious really). How do we move into the 2023 low ? Option 1 – This 6 year base does what it’s meant to as the Dollar index finally roll over, giving the added ‘push’ to get us up and through that crucial $1400. If that happens, I think we’ll climb to between $1550 and $1650 (maybe a little more) before correcting into 2023. Option 2 – Sideways, rangebound, tedious. Option 3 – The base and support fail, leading top a waterfall decline and new lows as we go into 2023.
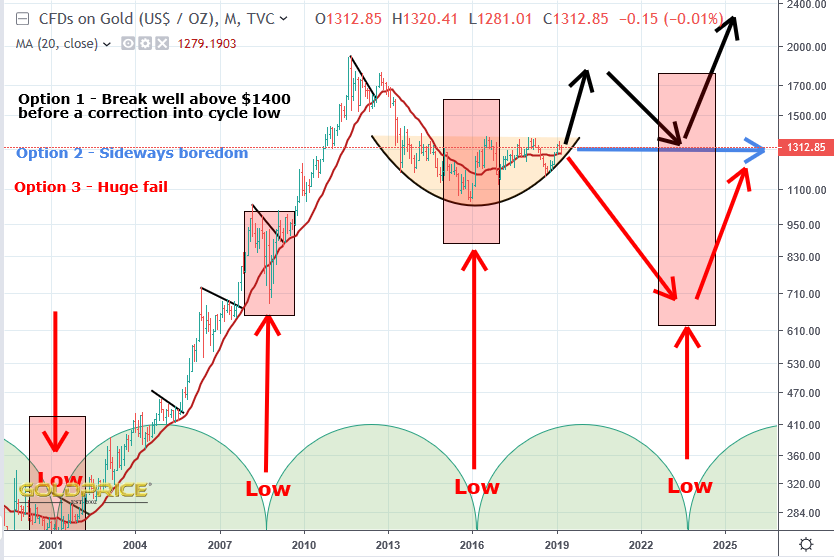
I’ve posted many charts to support Option 1, but I have to acknowledge the alternatives. My assessment is Option 1 – 80%, Option 2 – 10%, Option 3 – 10%. The odds will change if/when we see that $1350-$1400 region breakout, or support failure (which is in the $1240-$1260 region and rising each week). There is also rising (VITAL) support from 2001, which is closer to $1200.
Okay, so to sum that up, gold either goes up, stays the same, or goes down. I think we can all agree with you there. 🙂
I think your guestimates are a bit off though. I give Option 1 – 10% and the other two options – 40%.
Ha ha – I do like to state the blindingly obvious sometimes. I think the visual showing the convergence of price, moving average and support are significant though, along with the timings of the cyclical lows.