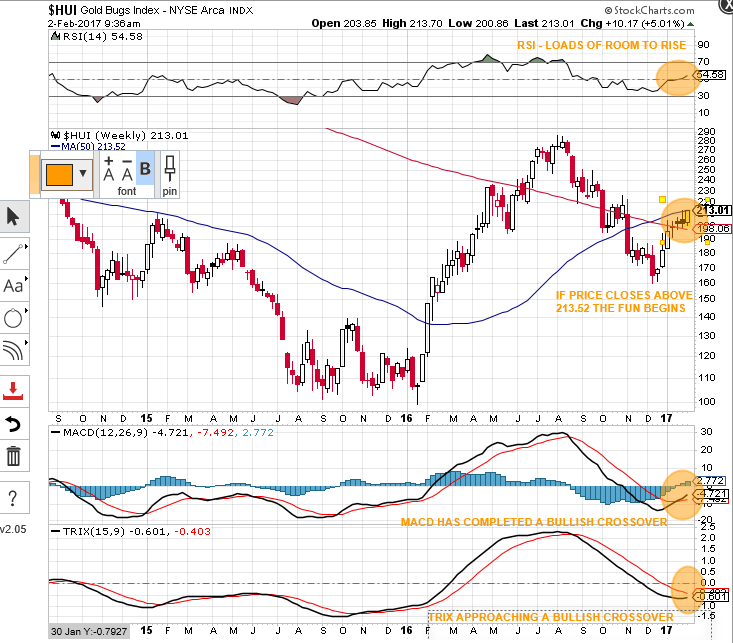
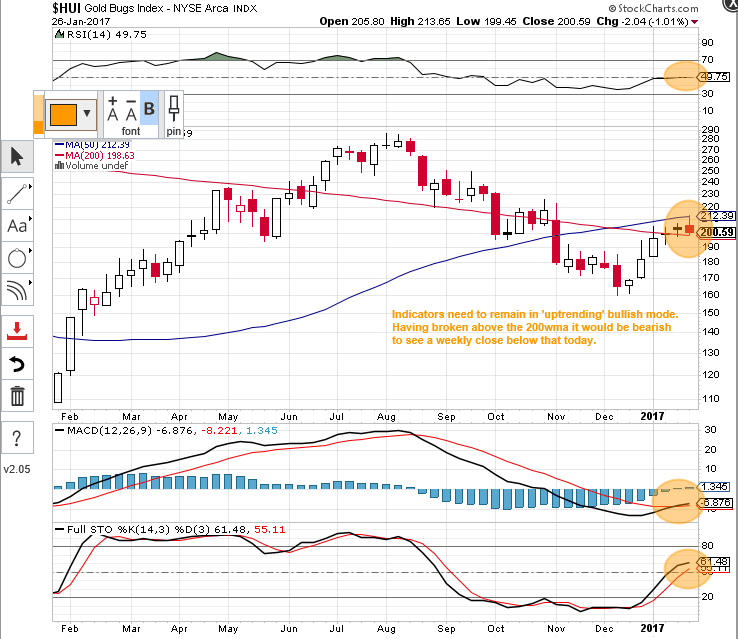
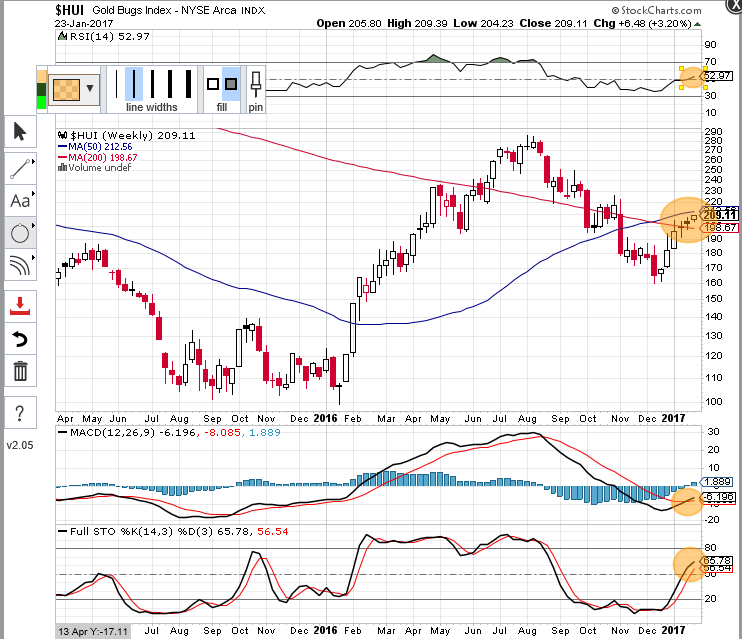
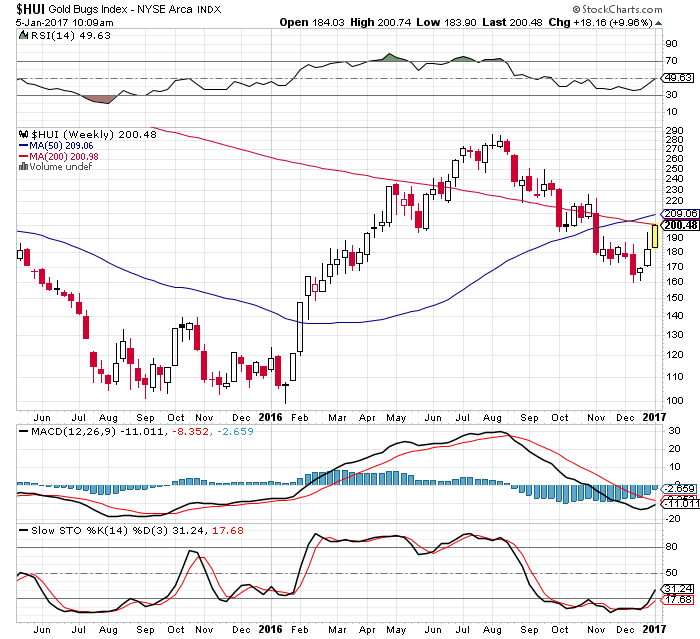
HUI Close To Breaking Above Moving Average Resistance
Appears to be upwards for the time being. I’m very aware of the market moving events later this week, and who really knows what will happen there. First off, here’s a chart I posted before the inauguration…

When I look at the HUI chart (daily timeframe), I see this…
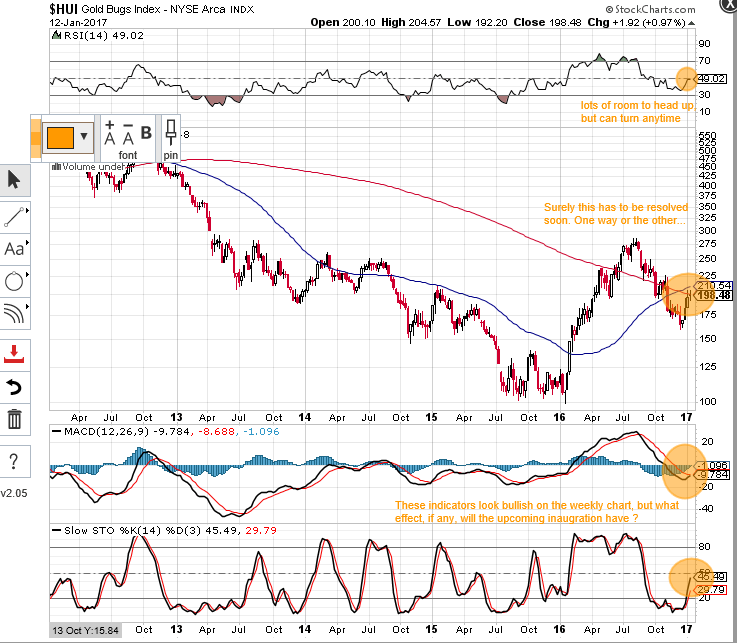
But changing the settings to view the weekly chart, things look a little different …
I am trying to be on the right side of the overall trend. I could be wrong here, but what these indicators are saying to me is that short term we may well see some downside, but the trend is up. I’m rubbish at day trading, or even week trading (lost as much as I gained last time I tried). When the big picture trend looks down, I will be out until it turns up again, but, at the moment, the charts above look ok to me.
That escalated quickly…
An odd set of circumstances. China taking a break (Happy New Year), Dow Jones/S&P surging, dollar showing weakness. More than the usual amount of political uncertainty. Here’s a chart 
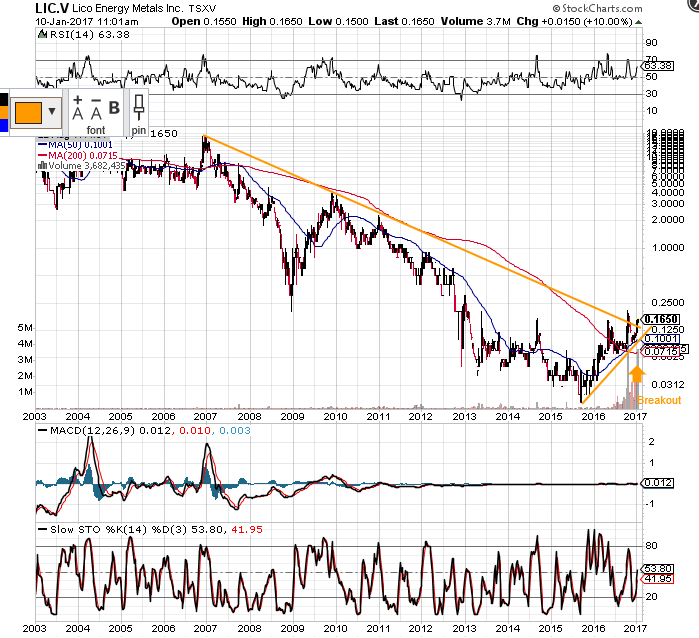
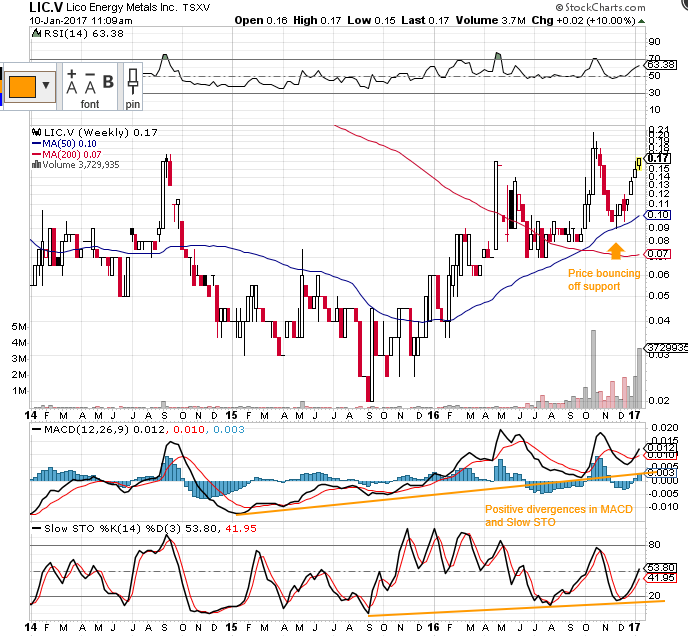
…doesn’t do any harm. Uranium is something I’ve taken on board, as well as this one. Lico Energy Metals Inc. I posted about it a few weeks ago. If you believe the demand for rechargeable batteries will continue to rise, both Lithium and Cobalt miners should do well. As always, do your own research.
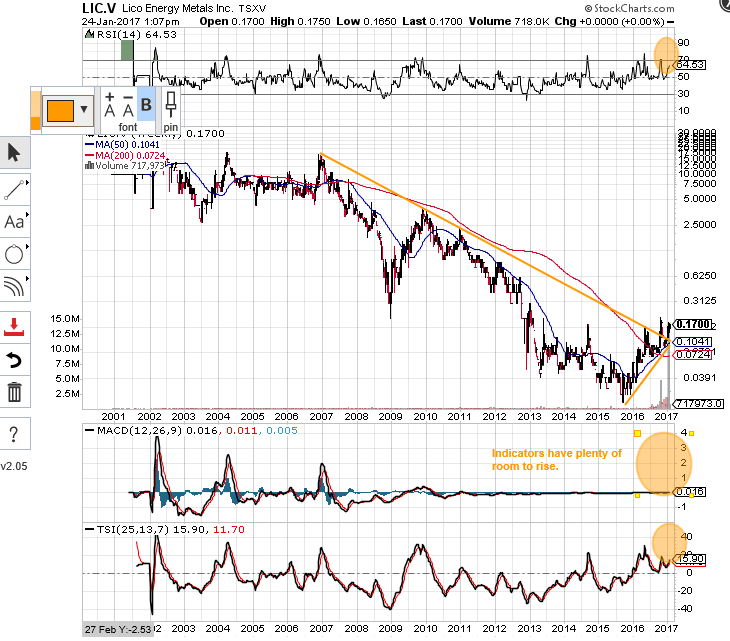
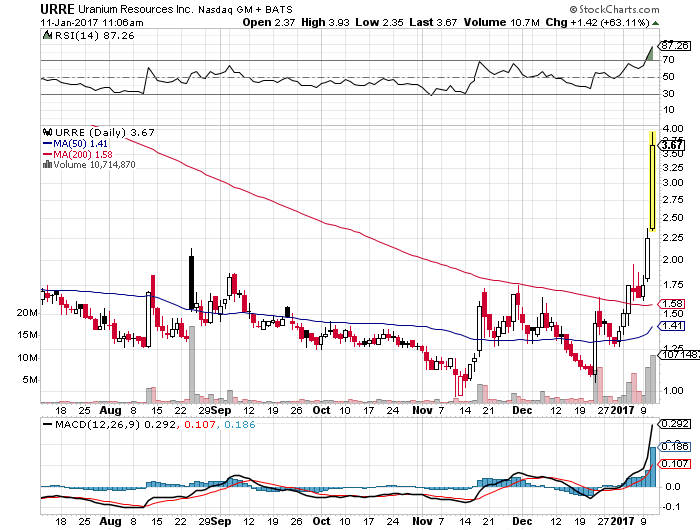
I’ve seen a 58% gain in a few weeks, so thought I’d share. Do your own due diligence of course.
Chart says it all…
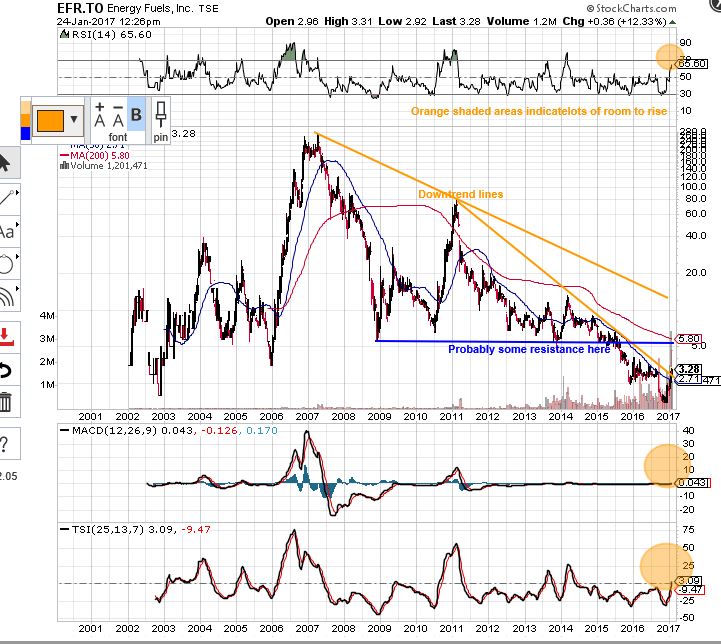
I added this to my portfolio a few weeks back, with the charts looking good. 40% gain so far, and an important test here at a line of former resistance. Could be on for a quick double if it breaks out.

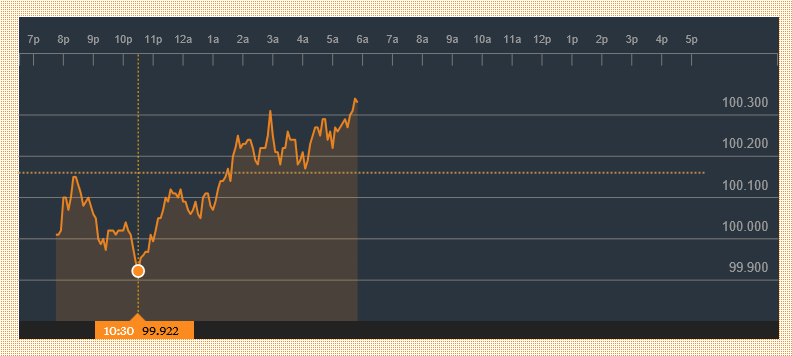
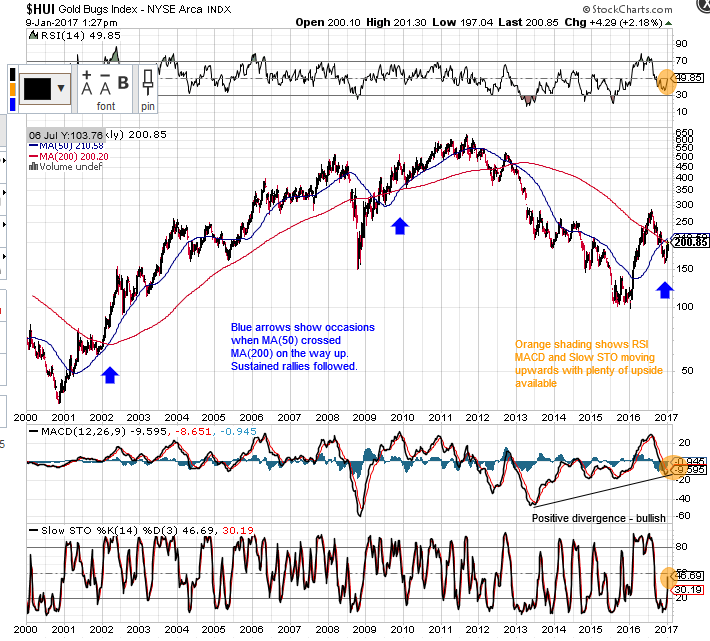
After very briefly falling below the psychologically important 100 level, we’re seeing something of a rally. Will it last ? I doubt it, but the progress of gold/miners may take a breather if it does – this doesn’t alter my bullish expectations over the coming weeks.
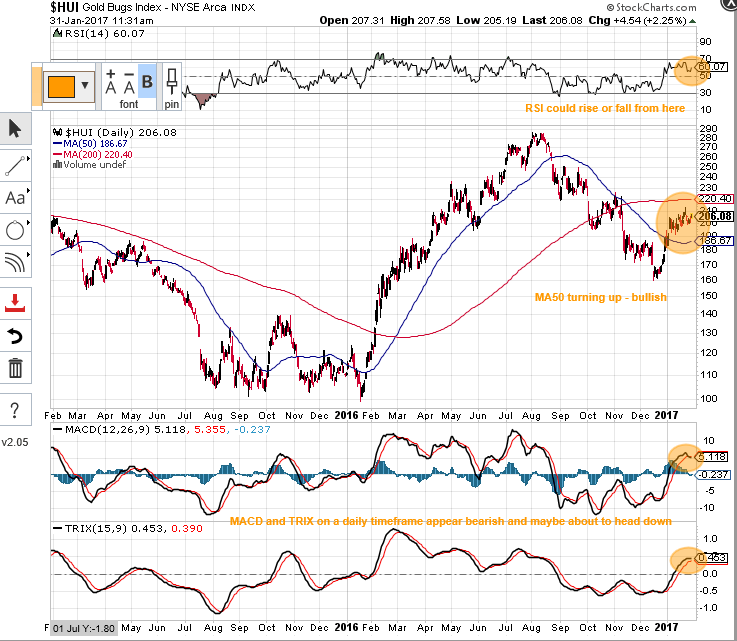
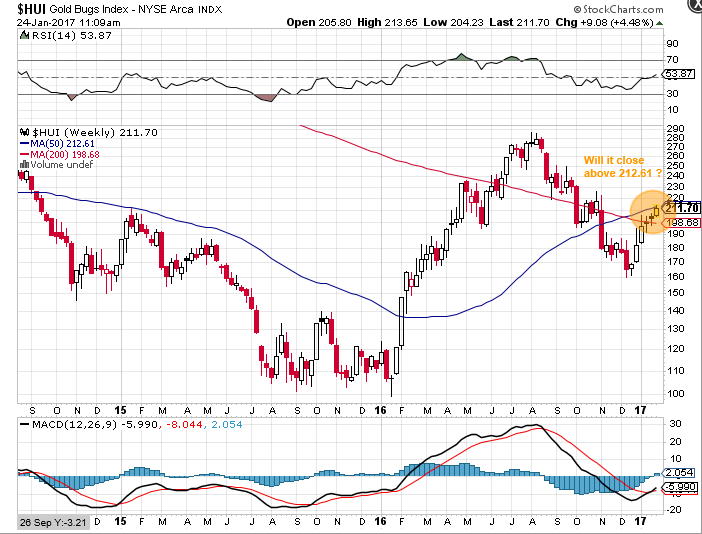
In addition to Graddhys excellent post on PM’s below – here’s how I see the HUI.
Viewed from this perspective it looks like we’re now in the next leg up
As I’ve got a good wedge invested in this, I’m watching the chart closely. Ignoring short term ups and downs, which can be huge, I’ve been trying to get a handle on what to look for when it tops. It could plummet from here and it could go up over 500%, but based on history what’s reasonable ? I’m ignoring fundamentals, news flow etc, etc, just looking at the weekly chart back to 2000. In 2003, the stock rose rapidly to 50 Cents. It did the same last year. Taking that as our starting point, in mid 2003 it took out a zone of resistance just below $2, it did the same a few weeks ago. Last time it rose to $6 in the following 6 months, with a spike to about $9 (before rising further in subsequent years).
Do the indicators support more upward moves in the price ? Well, just looking at a few – the RSI spent 8 months above 70 last time, that would give us until about June. The MACD hit at least 1.0 last time, we’re currently on about 0.5, and the TSI hit 75 – we’re on about 53 just now.
IF history is a guide, it might be reasonable to expect some sort of peak in the early Summer. Of course, we’re in a very different world now, compared to 2003…
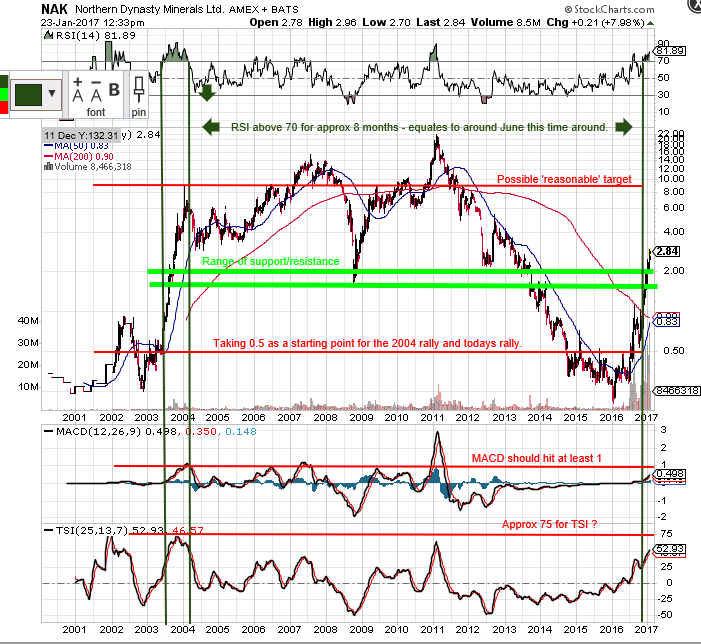
Edit : Also bullish is the approaching 50wma/200wma crossover.
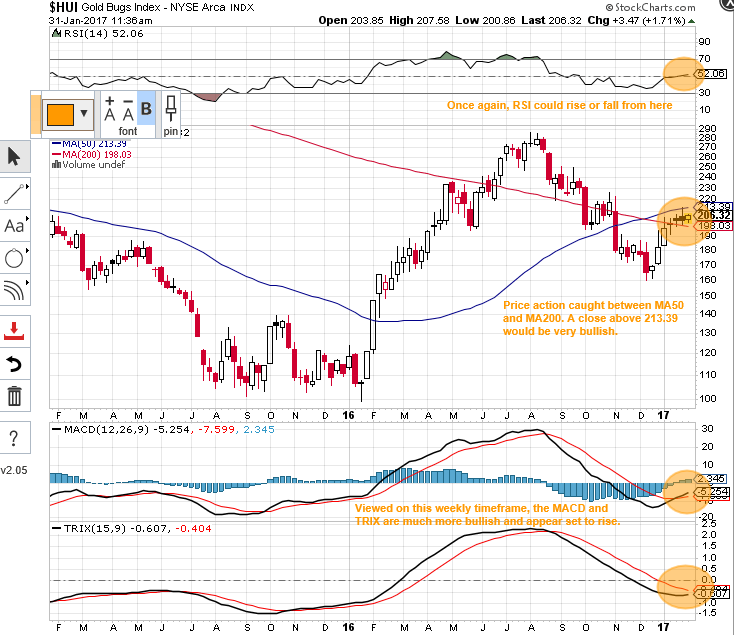
So here’s the thing – I’m looking at these indicators (on a weekly setting rather than daily), and thinking it all looks pretty promising to me. Here’s the chart/indicators…
The MACD and TSI are crossing over and pointing upwards. Pretty bullish. Full STO recently started rising from its low point, and has room to rise further. Bullish. I’ve looked back to see how the UI seems to work (in bull and bear markets). Long story short, if it’s risen above about 15, then starts to fall, the HUI doesn’t stop rising until the UI drops to (approx) 5 or even less – it’s currently on about 14, so has a good way to go yet. If these indicators are anything to go by, we have further to go on this leg up. Having said all of that there is always the exception that proves the rule 
With gold on the move today (around $1214 at time of writing), it looks highly likely that the miners will push higher too. The HUI closed last week at 199.29, just a fraction below the 200wma at 200.19, which has acted as resistance lately. Different types of chart analysis show a confluence of resistance levels around $1200-$1220. Unless it breaks down (dollar strength), it looks like we may clear an important hurdle here.
Some of these indicators are bit of a dark art, although I understand moving averages/RSI/MACD type stuff. Anyway, one I haven’t looked at much before is the Ulcer Index. Sounds like something your Doctor might be more familiar with…
I noticed that when it peaks, the HUI reaches a low point (follow the orange lines upwards), and when it drops (to within the two red lines I’ve put on) the HUI reaches a peak (follow the blue lines up). So where are we now ? Well it looks like we just passed a significant peak – in fact the level of the green line (20+) has only been reached 4 times previously in the last 11 years. So, on the face of it we ought to see the HUI rising as this indicator falls into its next trough between the red lines.
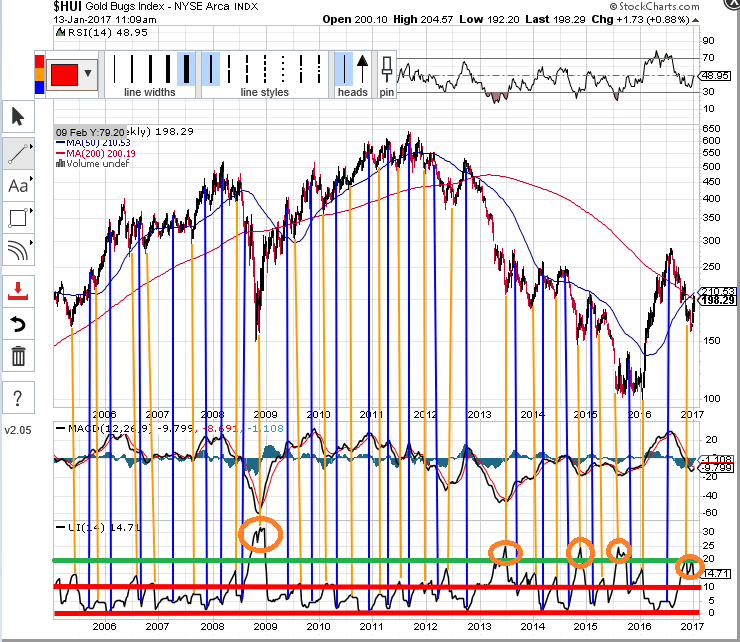
If nothing else, it’s a pretty picture, lol.
Looks like it’s coming up to decision time, and curious that the inauguration is just a few days away. This applies to the whole PM sector of course, not just the HUI. So many great articles on here lately – some bullish, some bearish. Personally I welcome all analysis, because you need to know all the possible future scenarios and what is making each outcome likely or unlikely, before you can start weighing up the odds.
Anyway, back to the HUI. Will it, or won’t it get a weekly close above that 200 week moving average. You can see on the chart below how it’s been holding us back.
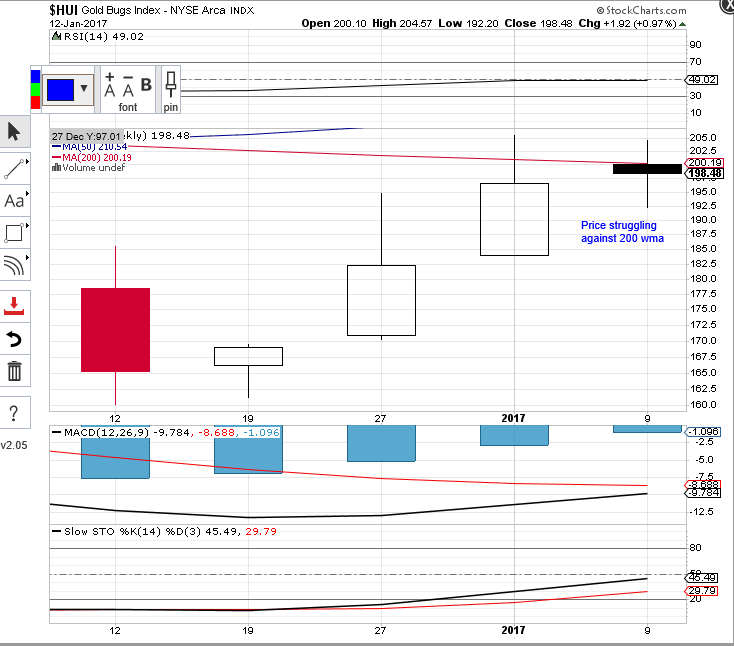
I think I’m right in saying we’re running out of time from a ‘cycles’ point of view in the short term, so we either punch above now, then back-test from above, or fall back and have to wait for another go at it. If we don’t look like closing above later today, I’ll be scaling back my positions in anticipation of lower prices. The chart below captures some of the key points I’m looking at.
Good luck everyone, and keep the excellent posts coming.
Edit: the 200 wma is currently 200.19
After yesterdays huge moves in the sector, I thought I’d practice drawing some lines on a chart. I picked Denison Mines. I recently rebalance my portfolio with some Uranium and Cobalt plays, and it’s been a good move. Big up to Graddhy for his really useful posts on here. I’m no expert chartist, but here’s what I’m seeing anyway…
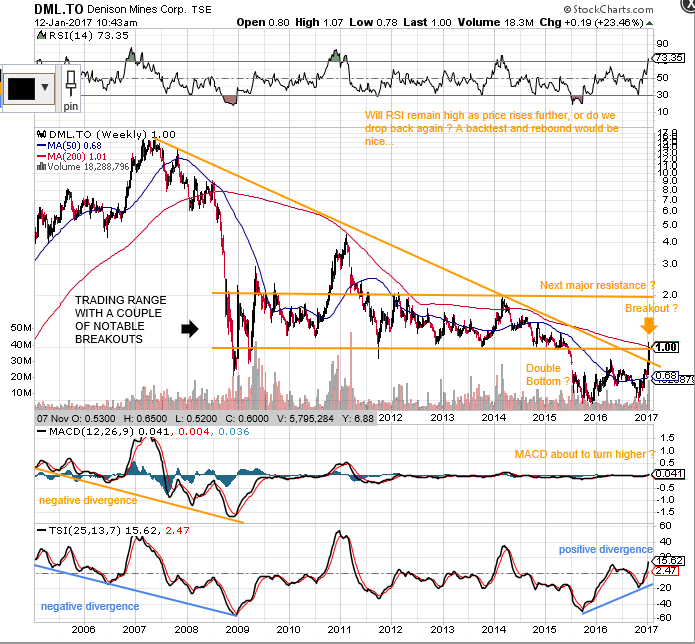
Edit: when I say, a back test and rebound would be nice, I’m referring to price, not RSI.
This one’s up over 40% today…
When viewed on a weekly basis over a longer timeframe, the HUI looks bullish to me. I’ve annotated the chart with a couple of my thoughts. It looks as if the next large move will be to the upside. Of course, I could be wrong, especially if we get a strong dollar rally. Curious that the miners haven’t rallied much more than the underlying metal in % terms today. Not sure what that means, if anything. Ideas ?

As the demand for lithium for batteries rises, so does the demand for cobalt. There’s plenty online about the potential upcoming shortage. I thought this one looked worth a punt and jumped in a couple of weeks ago. The second chart zooms into the last couple of years, so you can see the indicators more clearly. If the electric car revolution takes off, this sector could get interesting. Another one worth a look is Freeport-Mc Mo Ran Inc. I’m sure there are others, and there may be some here with some really useful comments. As always, it’s important you do your own due diligence.
Well, from a general trend perspective, it still looks good to me. Could it suddenly change, with everything heading south ? Yes, but if we see a little more dollar weakness, all things being equal, I’d say the odds favour a continuation of the rally (for now). When we see another significant drop, it should soon reveal whether this is the real deal, or whether we have to revisit those nasty lows of late 2015. If the well documented support lines give way, we’ve had it. Decision time soon. Hold and pray, or cash out and cross your fingers you haven’t just jumped off the train as it start to pull away again. Gotta love this ! Thanks to all for your highly valued charts and posts…
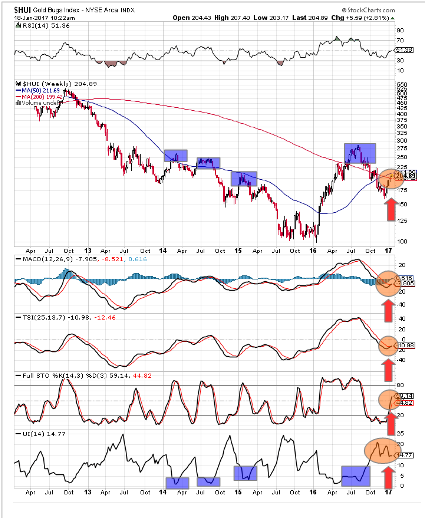
Which feels bullish to me. We also closed above the downward sloping 200 week moving average, which is currently at 201. Things get even better with a close up around 210, as that would be above the 50 week moving average. Here’s my first attempt at annotating a chart with some of my observations. I’m not a chart expert, so helpful advice appreciated if I’ve done anything wrong

An ‘around the apex’ move on the HUI. Historically these have proven to be the start of multi month (or longer) strong moves to the upside.
Just about to cross the apex. Will it close above it ?
EDIT – RSI, MACD and SLOW STO are all looking like they’ve turned up and are bullish.
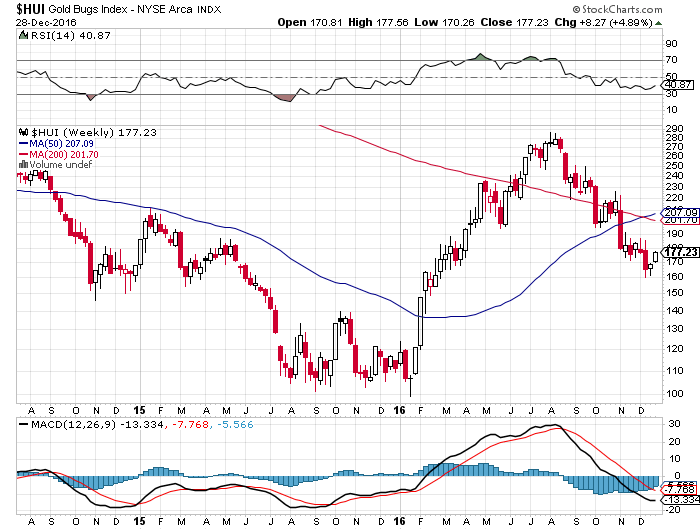
Just a reminder, from my post a couple of weeks ago. When these 2 charts display a crossover, with the 50 week moving average (blue line) moving above the 200 week moving average (red line), historically it has preceded a move to the upside (see my 3rd chart).
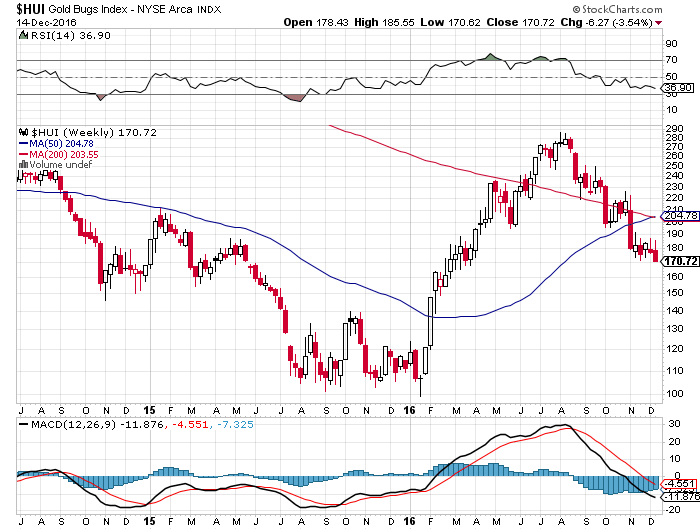
Interestingly, this will be the first time the 50wma has moved above the 200wma, with the HUI below the crossover point. We’re currently around 177 on the HUI, and the moving averages just crossed over somewhere around 204. I also notice the RSI and MACD are beginning to turn upwards…
We need a rapid move above the 200 level to prevent these averages making a bearish crossover. Based on history, and a good weight of evidence from others who have posted here, that is what I’m expecting. BUT, I’m not 100% convinced, because there is also a good counter-argument which suggests more downside. As a result, I’m back in the game, having bought selective miners, with more ‘dry powder’ to deploy once I’m convinced.
Hi folks, just trying out my first post and sharing some thoughts. Go easy on me
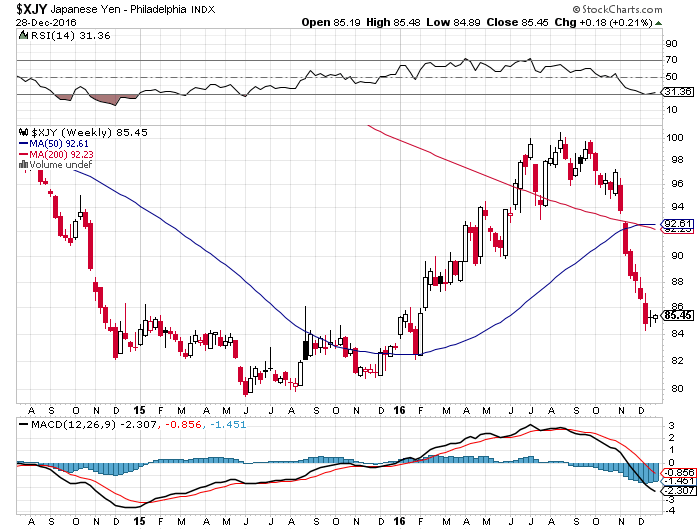
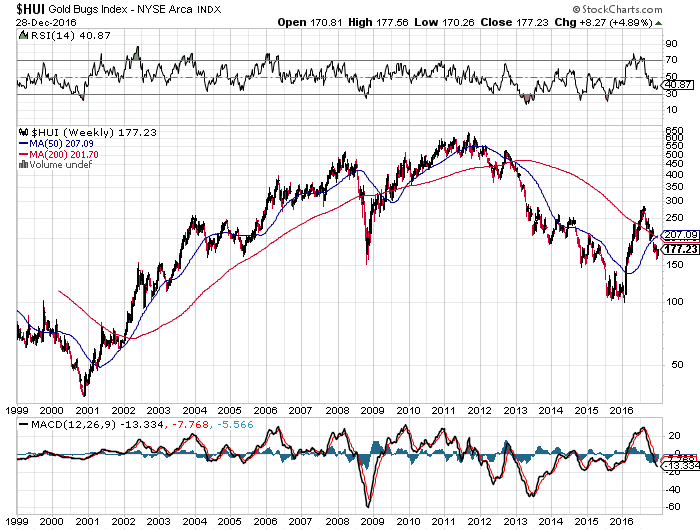
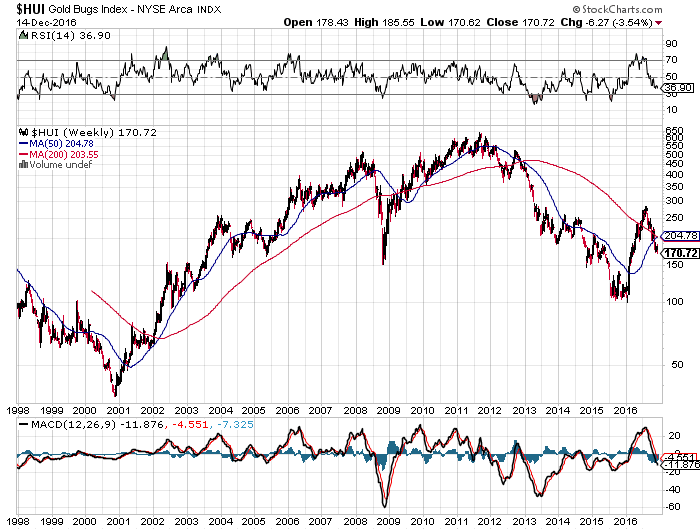
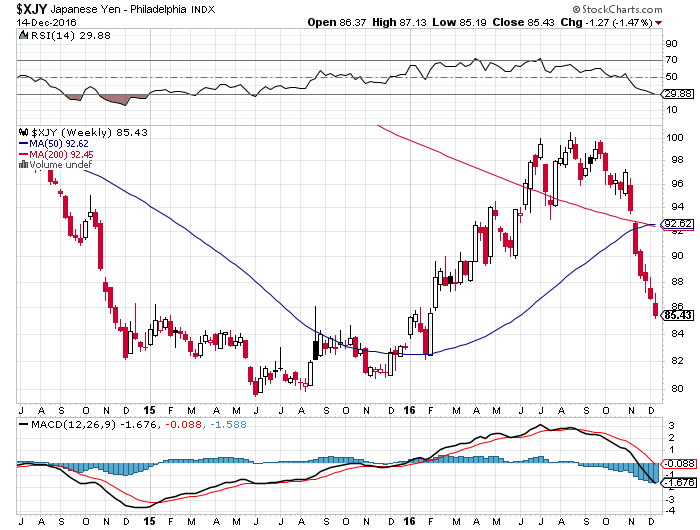
I’ve followed PM for about 10 years now and been invested, one way or another for most of that time. I ventured into the miners in January, after years of research and following some great sites including this one. There seems to be some really good, well researched views being expressed here. I read all your posts, and weighed up the evidence. I was convinced we’d hit rock bottom, and was delighted with the returns. Like everyone here, I wrestled with trying to decide when to bail out. I exited once I’d seen a couple of chart patterns fail. They are the charts which show the 50 week moving averages on the HUI and XJY crossing above the 200 week moving average and yet failing to rally strongly, and plunging instead. On the charts below, you can see that this is unprecedented. Maybe a sharp reversal to come ? If not the averages will soon cross over again, but in a bearish sense…
Thank goodness for some of the pointers I’ve seen on here for energy and uranium stocks. Not taken the plunge into cannabis yet though, lol.
What a year. Cheers everyone, seasons greetings and all the best for 2017