Nasdaq 100 vs Gold and Gold Miners
Hey Goldtent! With Nasdaq/QQQ and broad markets making new highs, it’s curious to see how gold and the miners are holding up.
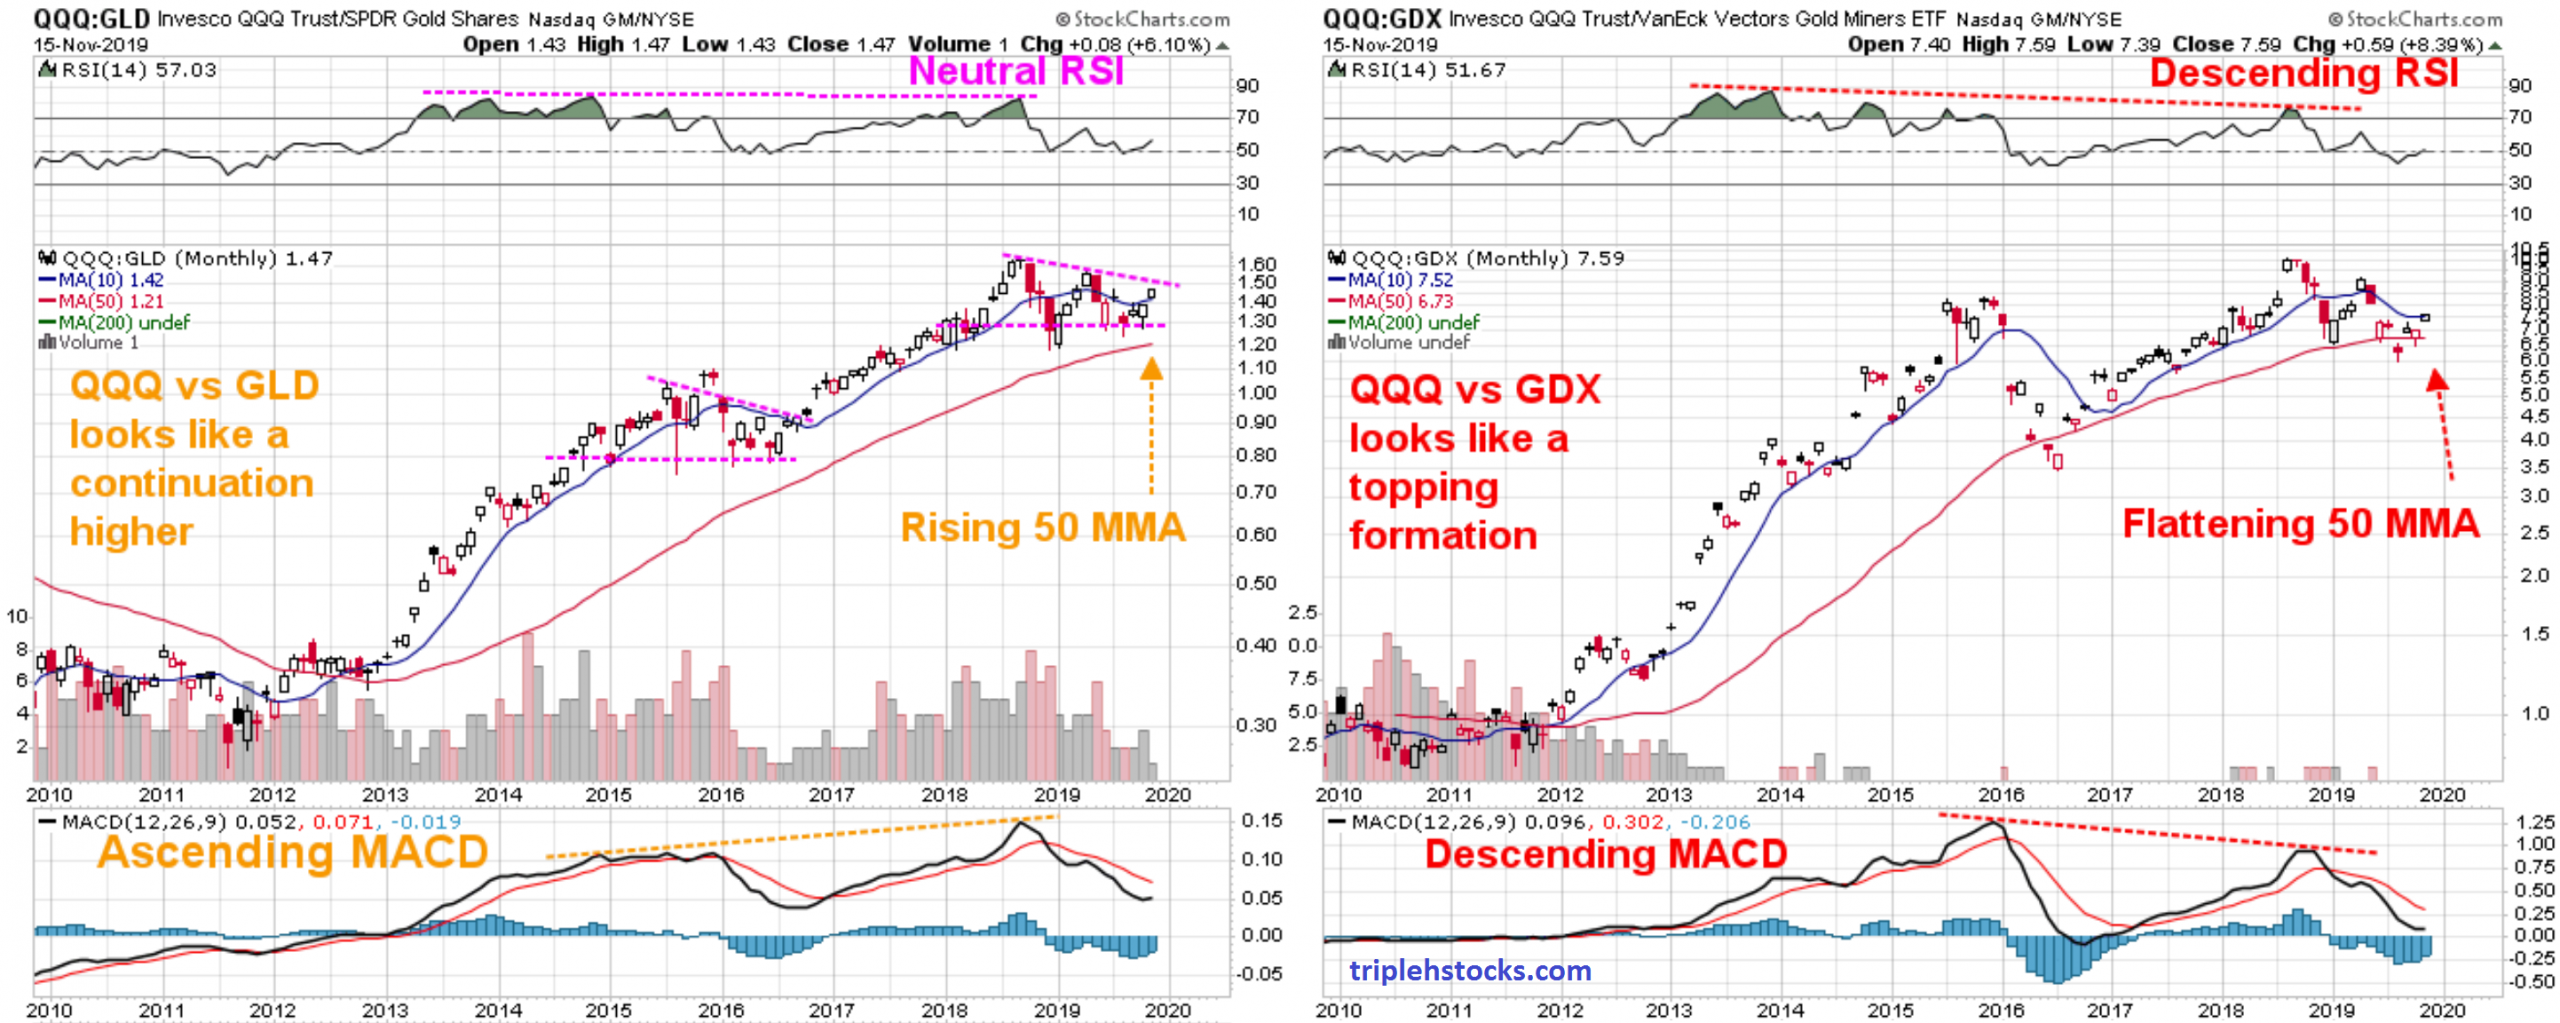
Here’s a combo chart showing monthly ratios of Nasdaq 100 vs Gold (QQQ:GLD) and Nasdaq 100 vs Gold Miners (QQQ:GDX). Two completely different pictures. Nasdaq 100 vs Gold shows a possible continuation higher with the QQQ:GLD ratio well above the upward sloping 50 month moving average, neutral RSI and an ascending MACD. However, Nasdaq 100 vs Gold Miners shows a possible topping pattern with a flattening 50 month moving average and descending RSI and MACD (examples of negative divergence). This supports a thesis that we can expect the Nasdaq 100 index to outperform the price of gold, but gold miners look like they can outperform the Nasdaq 100. With broader markets moving higher, we’ve been seeing small cap, mid cap and “value” index funds catching bids which can help support the price of gold miner stocks as a group.
Good look…thanks HHH
Good one. Thanks.
Nice! The monthly chart showing GDX is kicking Nasdaq’s butt! And gold is still struggling.. but keeps doing lower highs …
https://goldtadise.com/wp-content/uploads/2019/11/NDXGC1-5.7-0.09-GoldTent-Google-Chrome.jpg
https://goldtadise.com/wp-content/uploads/2019/11/NDXGC1-5.7-0.11-GoldTent-Google-Chrome.jpg
https://goldtadise.com/wp-content/uploads/2019/11/NDXGDX-306.7-0.17-GoldTent-Google-Chrome.jpg
Miners doing a better job at fighting the “FAANGman”. If you look at NDX:XAU from the 90s, gold miners were more undervalued relative to Nasdaq in 2018 than in the 2000 tech bubble!