“Just Getting Started…II”
Many thanks to Northstar for his recent post by this name. (And he’s absolutely right: if we are indeed in a Bull Market for Gold we we’re not likely to see Slow Stochastic readings on the monthly chart of Gold drop below 55 to 60.)
This ratio chart is very encouraging:
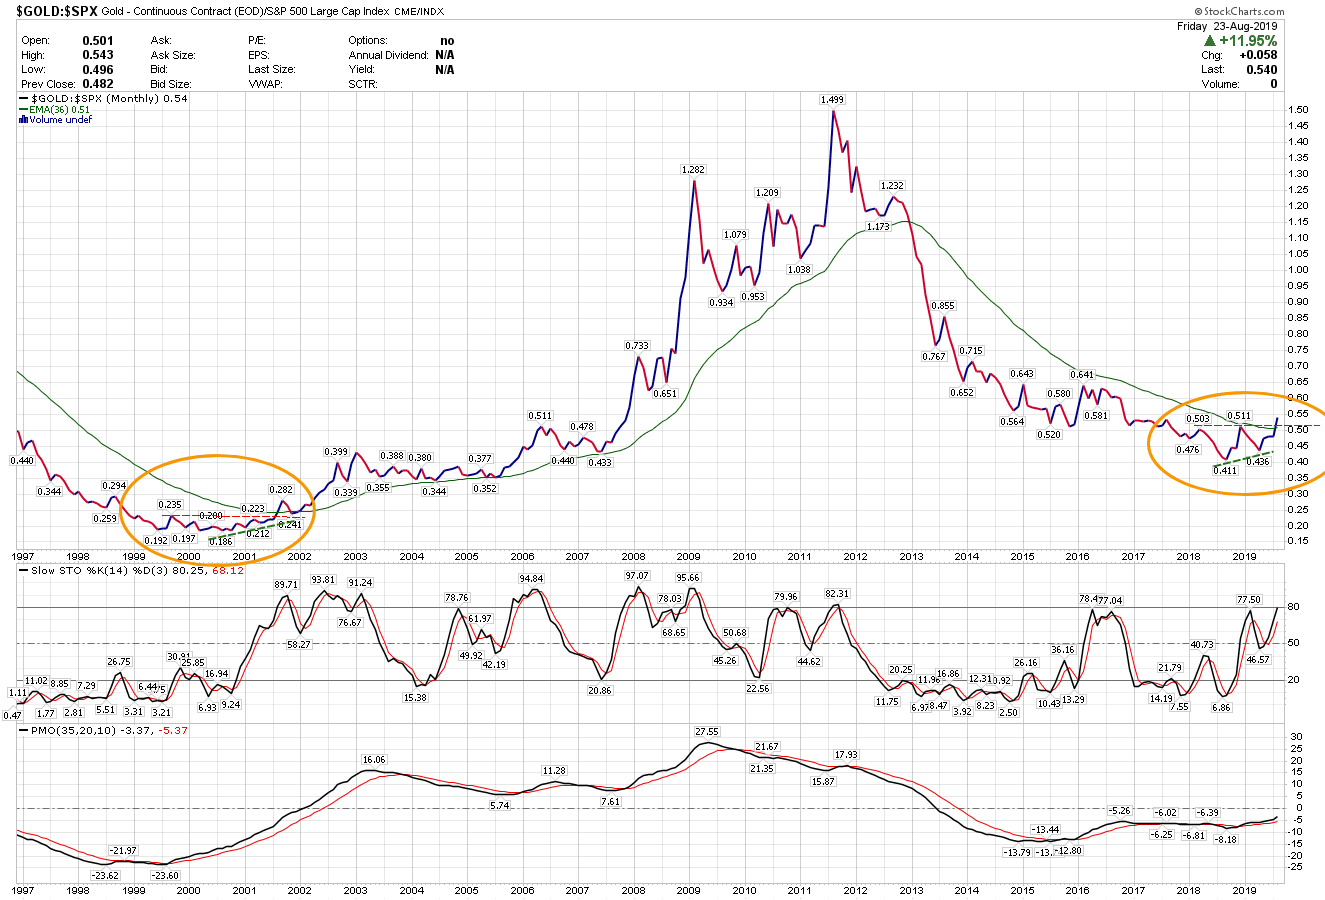
Here’s a closer look:
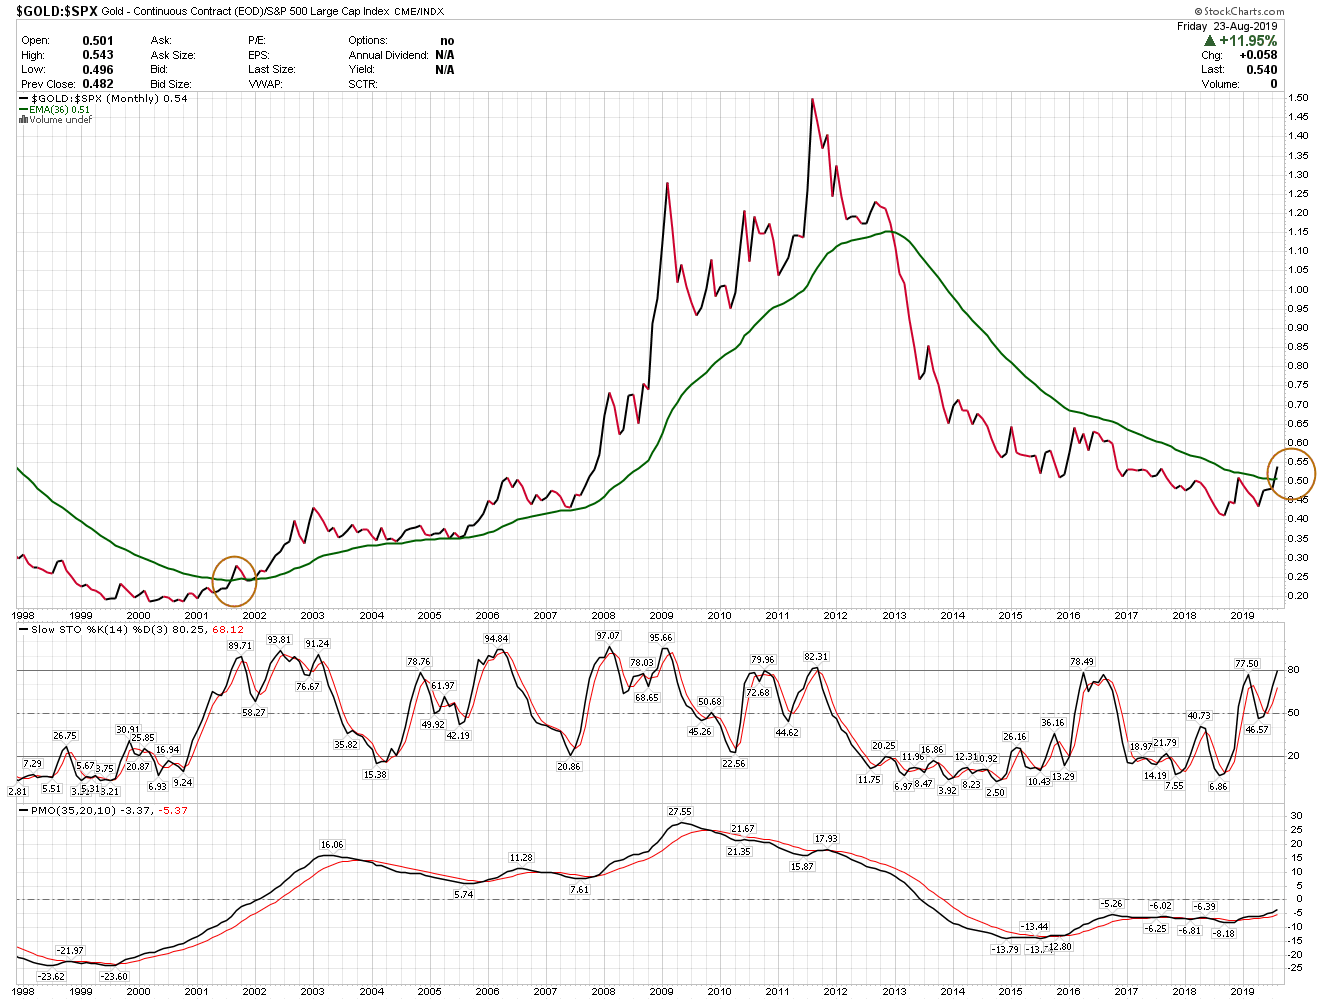
IF this ratio closes out the month of August at this level it’s clearly showing the beginning of a new cyclical bull market in gold – unless it immediately reverses back below the 36-Month EMA and closes below that at the end of September. (I’m betting that it won’t.)
Consolidations and corrections can provide clues as to the price high of the next cyclical bull move. From the high in January 1980 until the low in 1999-2001 gold dropped from $873/ounce to $253.20 – a drop of $619.80. Multiplying that difference by 2.618 gives 1,622.60. Adding that number to the 1999 low of 253.20 yielded an upside target of $1,875.80. The high in 2011 was $1,923.70 – only 2.5% above the calculated upside price target.
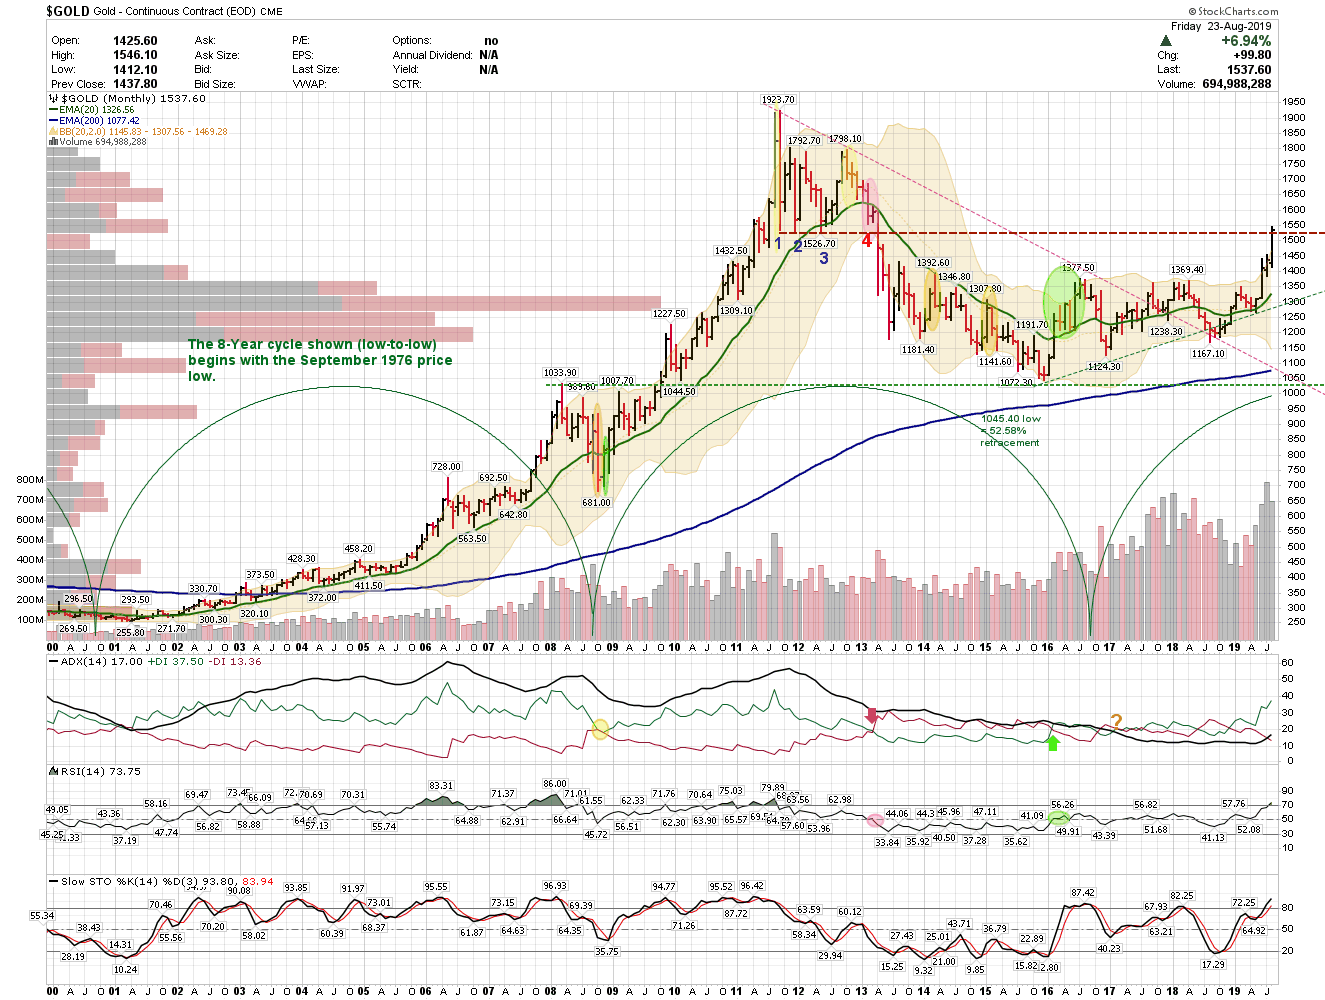
Using the same method and the correction amount ($878.30) from the 2011 high to the December 2015 low gives 2,299.30; add that to the 2015 low of 1,045.40 yields an upside price target of $3,344.70.
This involves price, not time. I’m going to ask my professional friend, a true student of W.D. Gann, for an opinion as to time. My “hunch” is it won’t take anywhere near the 12 years of the most recent gold bull (1999-2011). In the meantime here’s some work on the method used above from one very smart Canadian.
The embedded article was from August 16
Is it saying that the correction in gold happened
And is now over ?
Lovely charts and analysis BBM. Several of my charts have ‘spat out’ a target in the $3000 to $3500 region. If we break to New highs in the next 12 months, the 26 year cycle top in the late 2020’s would suggest something much higher. Maybe $3000 region before descending into the 2023/24 cyclical low, then much higher? That would probably mean $3000 or more by 2021/22.
Correction to typo above – 16 year cycle top, not 26 year.