More On Log Charts
Following on from Fullys excellent point earlier. Log charts are essential for tracking long term prices. Why ? Because over time, measured in FIAT currency, everything is appreciating logarithmically. What do I mean by that ? Everything is increasing in price by orders of magnitude. For example, a house here in the UK used to cost a few hundred pounds, then it was a few thousand pounds, then it was a few tens of thousands of pounds, now its into the hundreds of thousands of pounds. That’s the definition of logarithmic – you have to add an extra zero at regular time intervals. Witness the price of gold in Turkish Lira…
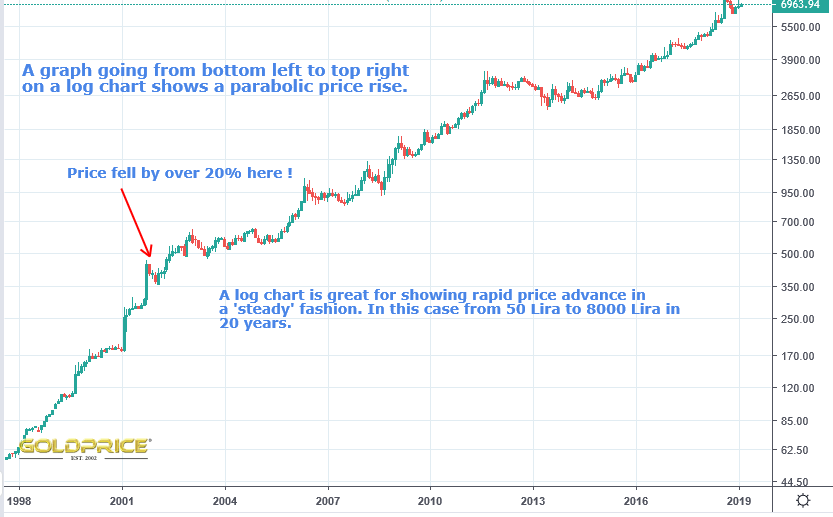

This is exactly what is happening not just to the Turkish Lira, but every FIAT currency on the planet. For those of you in the US, think about the price of a house at the turn of the 20th Century, then in the 1950’s, 1980’s and now. Logarithmic ? You bet.
Wow….this post went unnoticed ?
Great Stuff Weatherman
🙂