The US dollar fractal and BOINK point fascinate me … USDX and gold symmetries …
The US dollar BOINK point. Great name by the way, guys. Fascinating chartology too.
Three parts: The elegant $ fractal chart / Subtle differences 1999 vs 2018 / Other symmetry of gold and dollar moves in past 20 years.
The elegant chart: Thinking again of Rambus/FGC’s charts on the dollar fractal and the bounce labelled “BOINK,” I re-jigged a chart from Rambus and included the long term falling wedge downtrend line in blue to show this.
Something that fascinates me: will the US dollar ever go below that blue line again?

The goldtadise article by FGC with the similar chart is here:
Here is that chart. I added the red line at the bottom to ask the question: is it a genuine falling wedge and if so does it have a target of 160? The fractal scenario with the half way structure would suggest a target in the 110-120 range, perhaps:
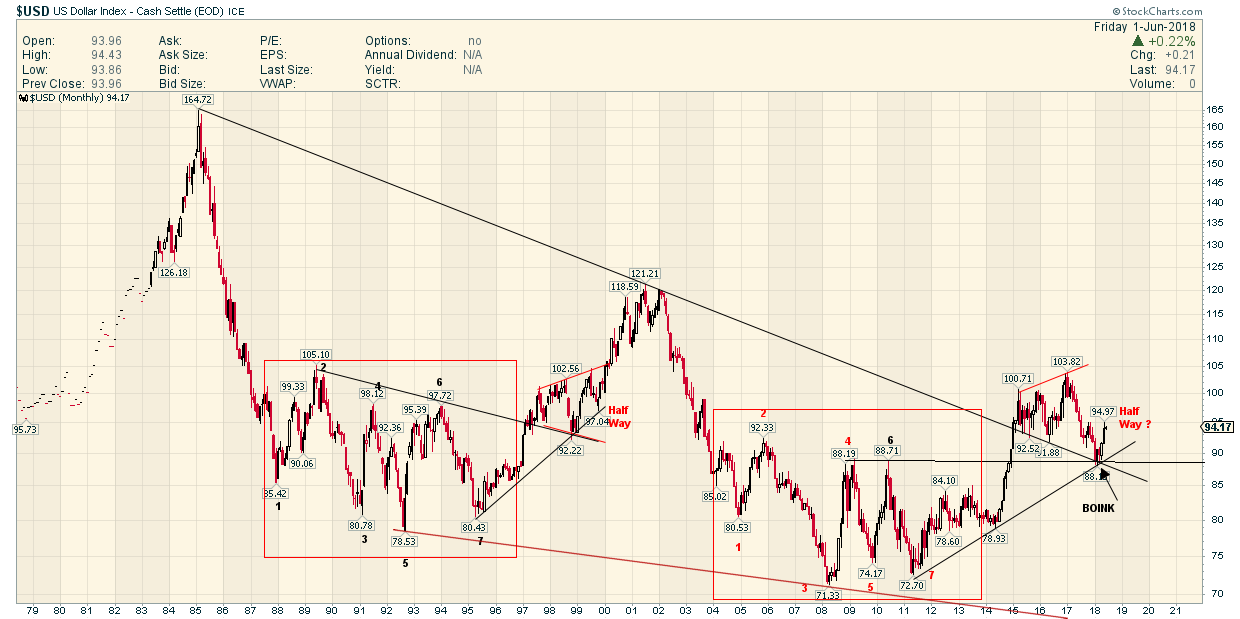
Now, the subtle differences between the two scenarios (1999 and 2018):
1. The first occasion (in 1999) the bounce was off the 11-year downtrend line.
2. The second occasion (2018) the bounce was not from the 11-year downtrend. The breakout never returned to that line. The BOINK bounce was from the larger degree 33 year downtrend line from the dollar top at 160 in 1985. Does this suggest a possible eventual move of larger degree than the move during 1999-2001?
3. There is another subtle difference in the dollar lows in each cycle. In 1992 the low came on peak 5 and in 2008 it came on peak 3 out of the 7 labelled in each case in black and red respectively on the lower chart. On the top chart the peak numbers were 3 in 1992 and 2 in 2008. The bottom came a bit earlier in the last $ bear cycle.
Other points:
It’s been mentioned that “the time for the dollar bull has run out” (2008-2016) – but:
1. These dollar bulls vary somewhat in duration and price magnitude.
2. The first bull on these charts was from 1992 to 2001 (9 years, not 7.5 or 8). Still, that would suggest a 2017 top this time around (2008-2017) but if it varies, maybe not.
3. The dollar bull previous to these two was from around 1979-1985 (6 years only) and was the most aggressive by far, topping at USDX 160.
4. The last dollar bear had what looks like a “genuine” re-test of the 2008 low in 2011 on the USA debt ceiling crisis, almost a double bottom. My little brain just tickles with the thought that this is somehow important. Maybe one could consider a 9-year bull market from 2011 instead, which would run to 2020 at the outside, plenty of time for a good upmove to a higher $ top.
I’m looking for measured moves on these charts and am not sure where if it all they would come from. Any ideas?
Parting thought if you got this far!
There is another piece of elegant symmetry between gold and the US dollar:
Turn of the Century/Millennium:
You can see clearly from the charts that the dollar had a good upmove from 1999-2001
Meanwhile gold already made its low in 1999 and re-tested the low in early 2001 and HELD a higher low.
Then followed the gold bull market and the $ bear market
Fast forward to 2008:
Gold had a good upmove from 2008-2011 ($1025 peak in 2008, crash to $680 and zoom up to $1920 in 2011)
Meanwhile, the US dollar had already made its low in 2008 (March, similar time to the intermediate gold high of $1025).
The US dollar re-tested its low in 2011 at the same time as gold hit its all time high of $1920 and the dollar HELD and made a higher low.
Then followed the dollar bull market and the gold bear market.
Surely both of those were gorgeous non-confirmations signalling a major change?
We have had a lower level non-confirmation since 2015.
2017 saw a higher high in the dollar compared to 2015 but not a lower low in gold since late 2015. That is perhaps something for the gold bulls to hold onto for dear life. I don’t know if this is important because we don’t have really convincing evidence of a top in the dollar yet … do we? Or a bottom in gold.
Some great deep thinking here DaveintheUK
Very good analysis
Thanks
Looks like many are shell shocked today.
I hope to see others chime in on this important review of the Dollar and Gold