THE MOST INTERESTING CHART ON THE PLANET
About 5 Years ago Rambus forwarded me a chart he called the “Epiphany Chart”
He was very excited…. and soon after he posted it at the Rambus Chartology Site
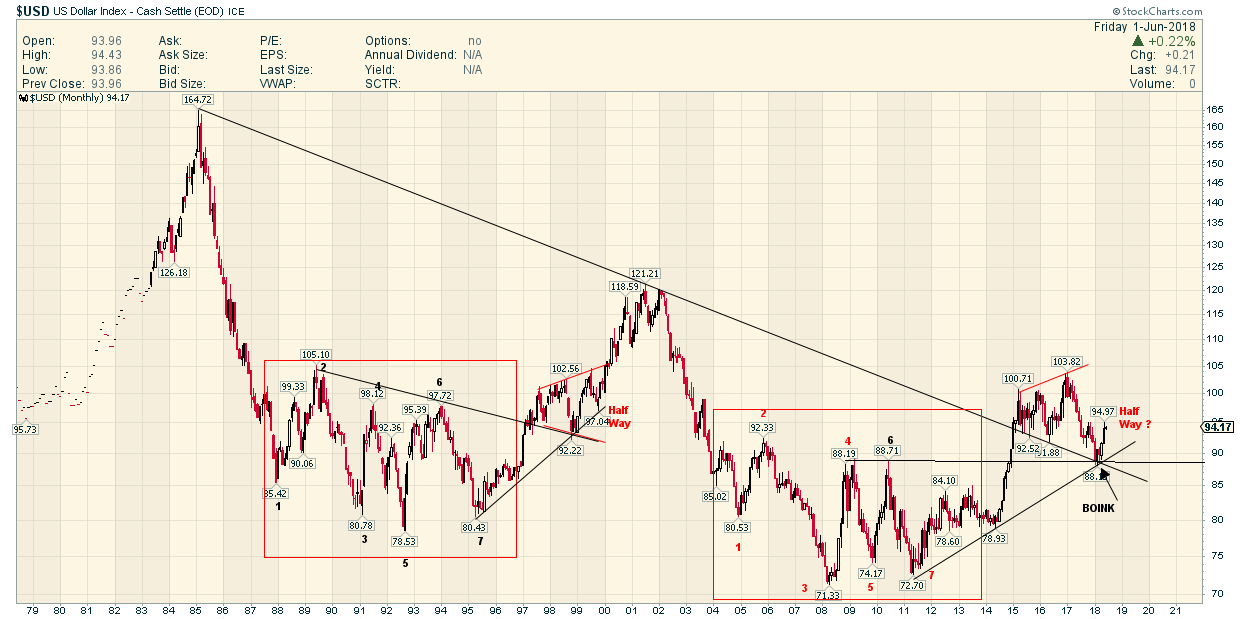
He showed the Dollar Bottom Circa 1987 to 1997 ( 10 years) with 7 reversals
and compared it with the Dollar Circa 2004 to 2014 (10 years) with the SAME 7 reversals !!
Well sure enough we got the breakout about a year later !
Then just as it looked like the dollar would breakout after a consolidation it surprisingly broke down…OR DID IT ?
Look a the recent spot marked “BOINK”
The Fractal is still in effect !
Pass the Popcorn
He sure is probably the best chartist there has ever been. Man is gifted.
Interesting things happened in 2000……
That’s all fine and dandy, but what about the ‘time factor’ ? The dollar cycle is 16 years ‘peak to peak’. Unless the cycle is broken, time is up.