How I’m using my own strategic trading/investing method to predict a rise in PMs
I got slightly annoyed today reading a crap bearish article on goldseek, a site I like a lot. It’s not crap because it’s bearish, it’s crap because the author(a CFA no less) picked 3 arbitrary indicators & bad trendlines to imply that DXY will run to 108 this year, and gold will fall to 900. The author put seemingly no effort into his article aside from his arbitrary indicators. Anyhow – these are my indicators, and they WORK (ask how I know). I’ve used them to successfully trade cryptocurrency, and the markets.
The 2 indicators are 1) Bollinger Bands paired with 2) 13/34 MA Cross.
See this monthly chart of gold:
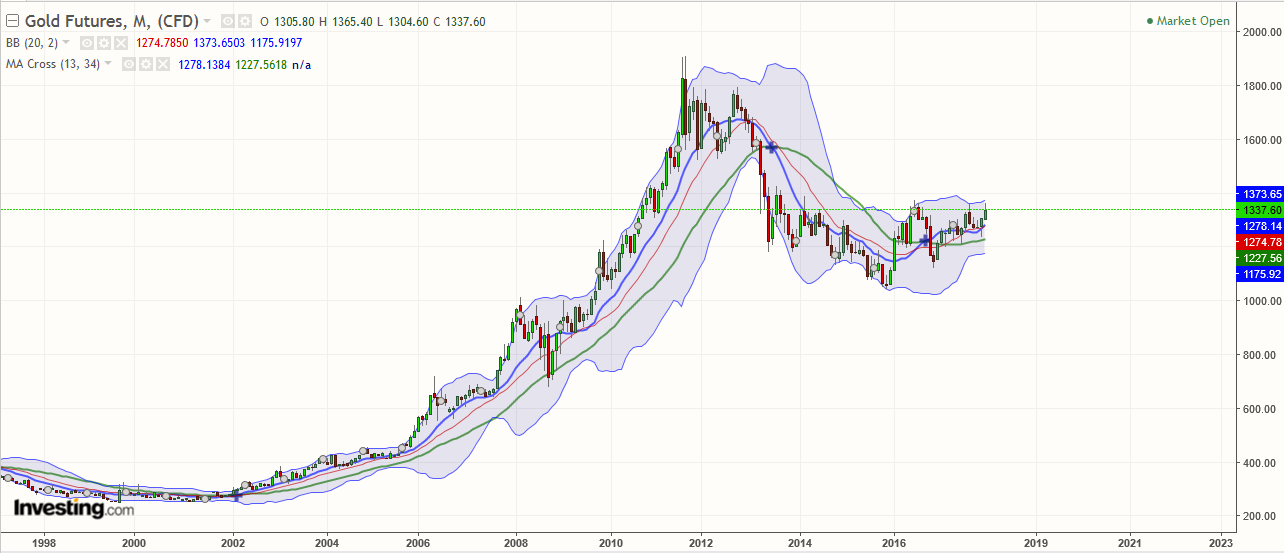
The key to the moving averages is to know that they’re lagging indicators. So you have to watch how the price is moving right now, and pre-empt how the moving average will adjust once the next candle forms on the chart.
On the gold chart above, The 13ma(blue) has been over the 34ma(green) since October 2017, which is bullish. But what’s even more bullish is that the 13ma(blue) recently started curling upward after the last 2 monthly candles. When the 13ma curls away from the 34ma, it’s typically a sign that price is starting a new trend/cycle in the direction of the curl. Not only is it showing RIGHT NOW on the monthly gold chart, but it’s also showing on the monthly USDJPY chart. Take a look below:

You can see the USDJPY is confirming a major breakdown, which is bullish gold. There’s my trade signal again. The 13ma got rejected as it approached the 34ma, and reversed course. Price followed through and confirmed in January. Let me be clear about this signal I call an MA cross rejection. The 13ma approached the 34ma and got rejected, curled downward. It will take MASSIVE price action/energy to get those MAs into a bullish cross now. The USDJPY would have to run up to 115, maybe higher next month. It’s highly unlikely, and once this rejection occurs, the trend has typically been set. My price target for USDJPY is now 102.00 (and perhaps lower later in 2018/early 2019.
As for how I use the bollingers, just understand that when they’re tight, a move is likely coming soon. Price will be pushing the bollinger bands outward in either direction during a trend. If you look at the monthly gold chart right now – there are tight bollingers, with moving averages in a very bullish position. My educated guess is the breakout is no more than 3 months away.
Glad to see you found what works for you NickG
I bet there is not 2 people here who trade exactly alike
Thanks for your thoughts Nick.
I try and use math to remove myself from the emotion of the market. The market is an emotional place and I try to use other traders emotions in my favor. Emotions don’t work in Boxing or Poker and they sure don’t work in the PM markets. FWIW I actually did some select buying today, it may turn into selling tomorrow I’m not sure but IMO today was not rational. IMO traders have not come too grips with a lot of the fundamentals that have changed in the recent 12 months (ie $USD, $WTIC & QT).
Good luck too your trades and thanks for your insight into your trading technique(s).
Thanks for the kind words! The method is a bit hard to explain without typing 3/4 a page, but I’ve found if you spend time staring at real time charts & watching how price pulls/pushes the moving averages, you can spot a trend in the early stages based on these MAs.
With regard to the markets, the next 2 days may be odd indeed. US pensions are doing month-end rebalancing. Today i saw the total imbalance is $16b bonds to buy by wednesday’s close (gasp! Poor pensioners) and $20b equities to sell.
Im also still seeing good traders on twitter not realizing inflation is taking hold. They’re expecting gold to fall with rates climbing, but if you look at TLT overlayed with gold price, you’ll see the correlation has changed in recent weeks/months and gold is now going up with higher rates, instead of selling off. The market will realize soon, and I think gold will have an amazing year. Good luck to you as well!
kinda like flying a plane in the fog, just gotta trust the gauges
And I didnt even have to mention the inverse head & shoulders on the gold monthly chart! Look at the crude monthly and you’ll see the same thing playing out, except crude is ahead of gold. But this is more confirmation in my opinion. Inflation sensitive commodities are breaking out. Timber too.
I’m watching $GOLD:$XEU It’s being squeezed at the moment into an Apex ending this Spring (or sooner lol). It’s interesting to watch. Europeans actually still buy physical. The Apex Is from the lows of 2015 and the highs of 2016 with mid range support at 10.77. Draw out the Apex it’s quite intriguing.
FYI, 13 and 34 are Fibonacci numbers.
Great work Nick. It’s amusing to see how many so called experts are stuck in a rut with their views on gold. If the cycles were in a bearish phase and indicators like yours were looking bad for gold, I would be bearish. Short term indicators go up and down in a bull phase, but the medium to long term chartology is telling me we are very high probability for a bull market in PM’s and very low (not zero) probability for a bear market.
Thanks for sharing.. Very happy to see another mind similar to mine 🙂
https://goldtadise.com/?p=392496
“I bet there is not 2 people here who trade exactly alike”
I bet there aren’t many who apply their own unique tools CONSISTENTLY either.
Whatever their toolkit, I respect those who have them and use them.
Personally, I prefer indicators that are more responsive (time sensitive) than MAs and BBs.
But I’m not a day trader either, so getting the IT and LT trends right is the key.
NickG, great analysis. I love using the longer term charts to see if I am on the right side of a trend. I was wondering if you could elaborate more on when you take positions in a trend you see developing and where you get out if it doesn’t go your way. I am trying to simplify my trading with longer term positions but want to prevent big losses. I know these are not quick answers so any short concise tidbits would be appreciated. Thank you.
Chap, I’ve used this mostly on shorter timeframes in cryptocurrencies, mostly because I’m not too active in stocks, but I’m starting to use it there now. The great thing for me is that I use it top provide context as to what point in a cycle/trend the stock is at.
To trade from this I wait for 1 of 2 setups
1) a possible new trend, where ideally bollingers will be tight, and MAs recently turned flat(read – a stabilized trend). I’ll take a long position with a stop loss below the bottom bollinger band. Once price moves up, it pulls the 13ma through the 34ma, and hopefully, if it’s a strong trend, will continue upward and expand the tight bollingers. You ride the trend and decide when to sell.
2) I call this setup a “trend continuation”, where after setup #1 has unfolded, price will consolidate and 13ma will move sideways/down to re-approach the 34ma. You can trade based on how the 13ma reacts as it gets close to the 34ma again. If it bounces and continues upward, the trend continues for another leg. If it crosses below, chances are (mostly, not always) that the trend is over. But remember – MAs are lagging indicators, so in reality you want to look at how price is acting as 13ma is approaching the 34ma. If price starts moving decidedly upwards, you know the 13ma will follow, showing a trend continuation signal. Since MAs are lagging indicators, you need to watch price and be able to pre-empt how the MAs will react once the next few candles form. It’s fairly easy.
I also suggest you pull up a 5 or 15-min chart with 13 & 34ma, and just watch how price pulls & pushes the MAs with every move. The same thing happens in longer timeframes, but more slowly. I’ll try to post some image examples later.