US dollar USDX long term cycles: breakout or continuation as normal? 3 Scenarios.
Surf and all you other tech wizards: how do you see the longer term trends in the US dollar? Do you see its continuing to follow the last 47 years of 7.5-8 year up cycles and down cycles? I kid of see from the longer cycles link that yo do but what about the possibility of a change in this alternation of 7.5-8 year up and down moves that we have seen in the past 45+ years?
I penned this in Nov 2015 ( and probably posted it to this forum too at the time):
http://1000gold.blogspot.co.uk/2015/11/breakout-from-long-term-us-dollar-bear.html
I was looking at Surf’s posts today:
https://surfcity.co/2017/12/13/usd-update-13/
and
https://surfcity.co/2017/12/29/longer-cycles-for-gold-and-the-dollar/
If the normal cycle continues, we are due a dollar bear market, because the last bear was 2001-2008 and the bull was from 2008-2016 with almost a double bottom test in 2011 so it might extend a bit. I sometimes use 2009.5 as the dollar low because there was a low in 2008.25 when gold hit $1025 and another one in 2011.75 on the US debt ceiling issue when gold topped at $1920. (Very Martin Armstrong style, I know. [This also has an interesting connotation because gold made a new high and the dollar didn’t make a new low, compare that with 1999-2001 when the dollar made a new high in 2001 and gold did not make a new low – this was a secular market change.]
In comparison, the last USD bull lasted about 9 years 1992-2001, so I could have imagined the present one possibly extending out to 2018 for instance (2009.5 to 2018.5 perhaps).
Anyway, do you think credit contraction dynamics might prevent there being a real strong downside to the current or upcoming USD bear cycle that might be expected to last roughly from 2017-2024 or thereabouts, following the previous cycles since 1971?
I’ll just spell them out: Bear 1971-1979, bull 1979-1985 bear 1985-1992, bull 1992-2001 bear 2001-2008 (or 2011 maybe?) bull 2008-2016/2017, bear 2017-2024-ish?
Looking at the long Kondratieff credit cycle that had its deflation in 1929-1933 and this time maybe in the credit contraction that started around the 2008 financial meltdown, that’s kind of an 80 year cycle event. That could trump (pun intended) the 40-odd years of up and down dollar cycles that we have had since 1971.
So I am thinking – has the dollar made a huge secular low in 2008-2011 and started a multi decade uptrend?
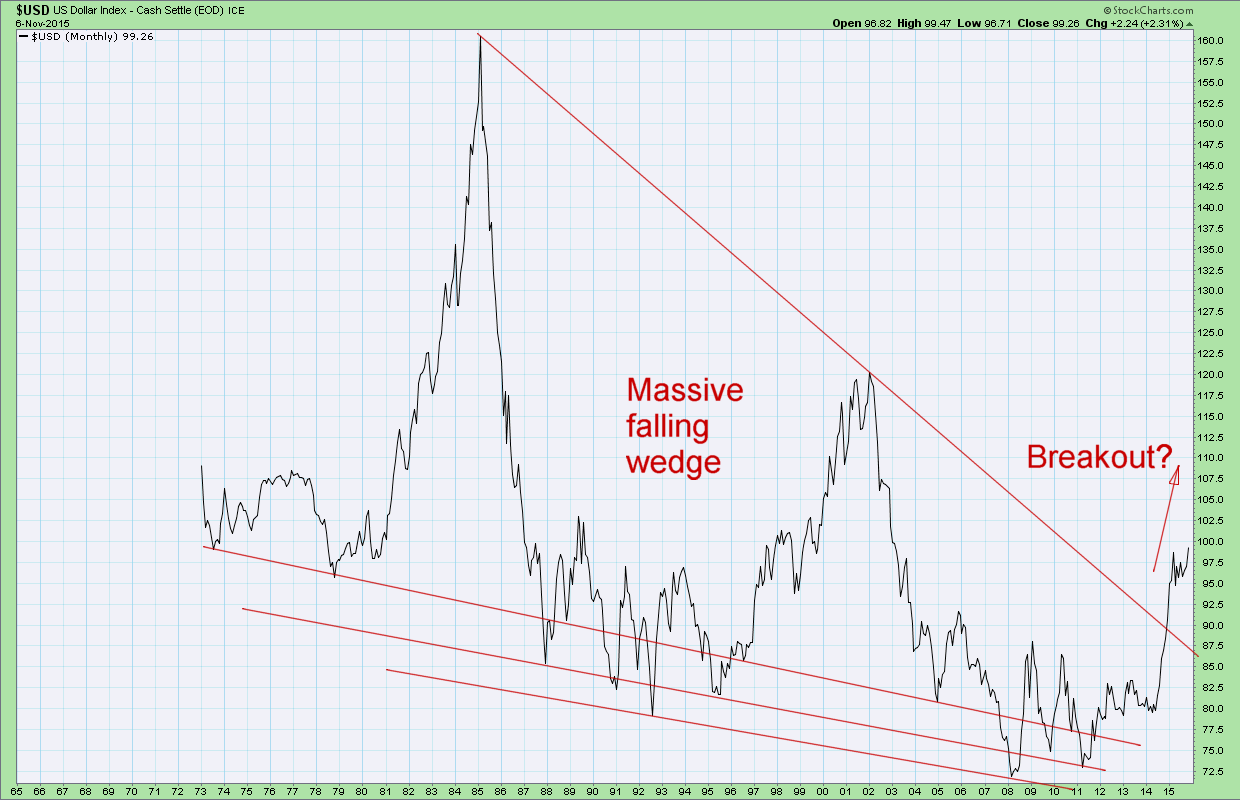
I am wondering if the dollar is going to break out of its last 47 years of trading and go sky high, maybe breaking out of the falling wedge that started at the 1985 peak at USDX 160 and going back to that level on some kind of Euro/Pound/Yen meltdown(s).
Alternatively, does the dollar just carry on with its lower lows during its bear cycles series, as it made its lows in 1979, 1992, 2008 and then whatever, 2024 perhaps.
I kind of look at the Euro thing and think it is going to be difficult for the USDX to go below the 2008 low around 70 with the fact that the Eurozone, Japan and also the UK are basket cases really, when you look at them. Who knows what could happen on the Brexit? Hyperinflation for UK first perhaps? Dunno. Any problems in one of these areas could send the dollar soaring. I wrote somewhere else that if any of these other currencies goes to zero, the USDX will go to infinity because of the geometric nature of the way it is calculated with the Euro, Yen and Pound on the denominator.
Even if the other currencies hold together I can’t see the dollar falling below 70 in this down-cycle, can you? I feel that there would have to be a very serious crisis in the USA to take the dollar below 70, like some kind of big war defeat or humiliation.
What do you guys think?
The pictures, kind of schematic I know. The “We Are Here”was in late 2015 on the chart:
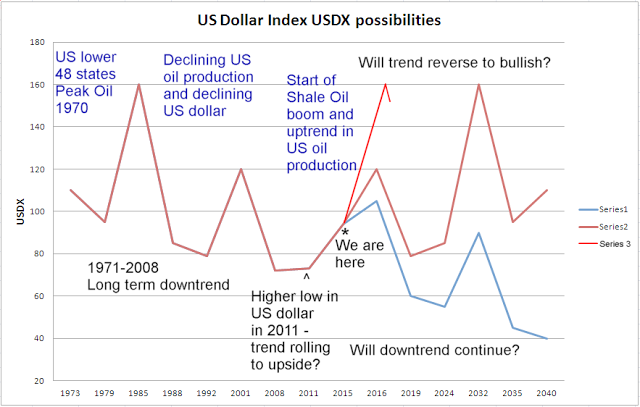
From above 3 lines I might imagine prevailing real world scenarios:
Blue: continuation of downtrend in dollar with lower lows again
Darker fainter red: gradual secular reversal of dollar to upside on slow death of Euro, Pound, Yen or ongoing US credit contraction, Japan style (like 1990-2009).
Bright red: Massive upside breakout of dollar on sudden worldwide credit collapse and/or sudden death of Euro, Pound and/or Yen.
The state of the dollar as of late 2015 on this graph was: it broke out to just over 100; that’s above its starting price from 1973 by the way and out of its 30 year falling wedge pattern. As of 2017, it appear to have peaked around 103 and rolled over – and is now down in the low 90s as I write (91.31, down 0.58 on the day):
Hi Dave, My cycle work in the USD shows that it’s longer 15 Year SuperCycle topped in Year 9 in early 2017. If correct, the primary trend should be down to sideways, moving lower over the next 5 Years into its next SuperCycle low. The USD also has a 3 Year Cycle and the SuperCycle is just 5 of the 3 Year cycles grouped together. Nothing typically goes in one direction but this rally was capped by the 30ema on the weekly charts which is Bear Market action according to Weinstein.
We will see rallies out of 5-6 month ICLs but they should be corrective in nature as the primary cycle trend is down (remember that Longer Cycles typically dominate shorter ones). The two moving averages on the Weekly to keep an eye on are the 30wema and the 200wma as both of those should be providing resistance to any rally
Cheers Surf. It looks like you’re kind of expecting “business as usual” in the dollar, more or less. That would be in line with the continuation of the post Bretton Woods money printing era continuing ad nauseam and no big deflation, etc. Some of the deflationists get obsessed with Kondratiev cycles and the 1930s but “we” (not we but you know that I mean) were on the Gold Standard then. Now it’s QE to infinity if needed.
I wonder what it means for gold? I’m a little fascinated by the 1982 and 1986-1987 rallies on gold, both from $300 to $500 in a longer term secular bear market. They both broke above the $430 level, which was to my mind equivalent to the $1500-1550 support that broke in the current bear cycle in 2013, an intrusion into that topping area to pull the bulls in as in Plunger’s great description of the gold bear that he posted recently. The second bear rally in 1986-87 did not register in other currencies, it was simply a mirror of the 40% fall in the dollar (a 67% increase in gold is almost the exact reciprocal of that). That means gold in Deutschemarks did not rally in 1986-87 so that rally was kind of an illusion.
So the 1986-87 gold rally was a total damp squib and anyone who got excited by it shouldn’t have been. I wonder if we will get a similar scenario in this cycle. It’s interesting to see how gold performs in GBP or Euros to get perspectives on this.
This is a fascinating market that will likely remain fascinating longer than I can remain solvent!
Gold in Euros is in a bit of a downtrend of lower highs and lower lows right now – and in pounds, it is just in no mans’ land. For me the £960-980 (GBP) level is key – it’s the breakdown level from 2013 and gold has been oscillating around that level for nearly 2 years.
http://stockcharts.com/h-sc/ui?s=$GOLD:$EURUSD&p=M&yr=8&mn=0&dy=0&id=p84715185119&a=422997387&listNum=1
http://stockcharts.com/h-sc/ui?s=$GOLD:$GBPUSD&p=M&yr=8&mn=0&dy=0&id=p84715185119&a=422997387&listNum=1
Annotated chart is at (Gold in GBP with 960 key level):
http://1000gold.blogspot.co.uk/2018/01/gold-in-british-pounds-gbp-in-no-mans.html
Look at the amount of tradin right at the zone where support was in 2011-2013 (£960-1030). I always look at 1000 GBP as a line in the sand but under £960, gold is still in bear territory. Right now it is fooling around with our hopes and teasing the bulls at 975 GBP.
My year end target on Gold is that it should at least test 1550. If it gets past that resistance, a move up towards 1700 is possible in 2018.
That would be very nice if it came true! Cheers! It’s good to talk.
WOW! As I look today the pound is $1.38. That is right in the support/resistance zone going back to the 2008 crash. I was not thinking the pound would likely reach over $1.37 after its crash below $1.20 on the Brexit vote. I thought $.35-1.40 would be BIG resistance.
Anyway, at $1.38 to the £ (pound), Surf’s dollar gold prices of $1550 and $1700 would be 1123 GBP and 1231 GBP. The latter would be a new all time high for gold priced in pounds sterling. If gold did get to $1700 the dollar would probably be lower (the all time GBP high for gold was in the region around 1180-1200 GBP in 2011.
I’m just leaving this here as a note for all people from the UK and because I am from there!
Sterling char. The pound at US $1.38 is in a key area:
http://stockcharts.com/h-sc/ui?s=$GBPUSD&p=M&yr=35&mn=0&dy=0&id=p84715185119&a=422997387&listNum=1
Great stuff Daveinthe UK