UUP & SLV
Gold and silver making a nice recovery so far this morning, we’ll have to see how they close on the day. However, even if they cross into positive territory, that wouldn’t change the nature their present structure – which is bearish for now.
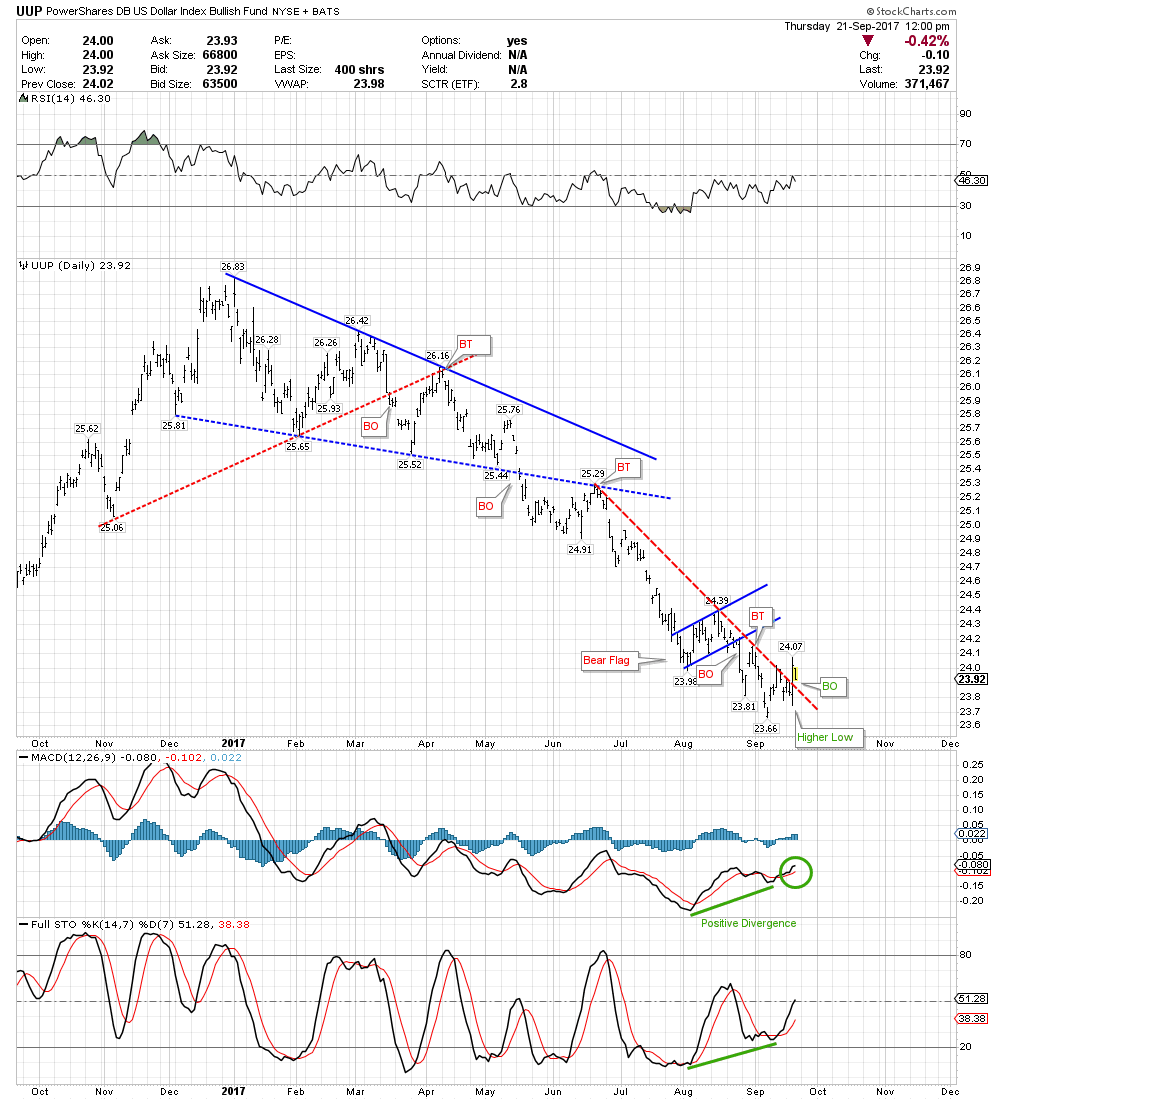
Below is the daily chart for UUP ($USD proxy), which printed a higher low before breaking out above trendline resistance, accompanied by positive divergence. UUP appears to be in the process of back-testing the breakout now.
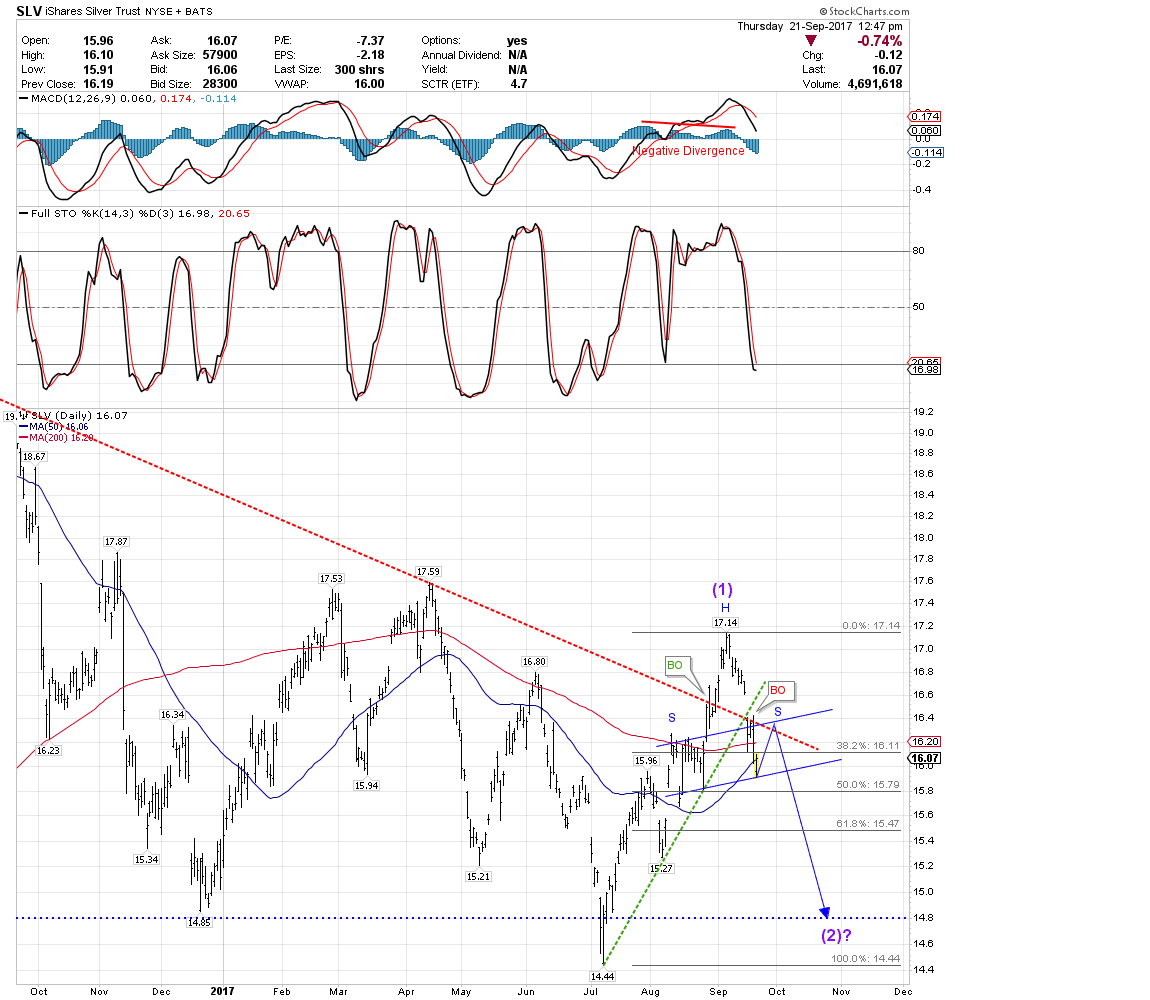
At the same time, Silver broke out above (red dotted) trendline resistance but failed the backtest miserably, gapping lower not only below former trendline resistance, where you would now expect to find support, but also breaking its (green dotted) bullish trendline drawn from the July low. Looks like another nasty “bull trap” PMs are famous for…
In terms of speculation – for Elliott Wave practitioners, any scenario other than wave (1) topping at SLV 17.14 ($Silver = $18.29) has been negated – which therefore opens the door to a wave 2 pullback for Silver here and now.
Wave 2’s typically retrace 38.2-50% of the prior move. Those levels are shown on the chart below, and correspond to $17.09 – 16.72 for comex $Silver. So Silver may be done with wave (2) already as of today…however…under EWP rules, wave 2 can retrace ALL of wave 1 and still remain valid as long as it does not trade below the beginning of wave 1, for comex $Silver that level is $15.14! I don’t think anybody expects that to happen, but then that’s just how Silver rolls, the opposite of what is expected – so be advised accordingly.
Otherwise, speculating further – I’ve drawn what could be a Head & Shoulders top formation, which would coincide with the a-b-c structure of a typical wave (2), with price target shown. Again – the H&S formation drawn below is pure speculation at this point. In any event, cancel your wave (3) party plans until wave (2) is finished with Silver.
Thanks, interesting times.
Stochastic doesn’t look supportive of such a severe pullback – it’s already very low – typically signalling a turn upwards is close.
Sure, as mentioned – wave 2 may be complete now, but:
1. i don’t agree that stochastics is already “very low” – it has just entered “oversold” territory, and can go lower – as shown on the chart;
2. formation of the right shoulder would alleviate oversold condition of stochastics;
3. with momentum down, both stochastic lines can remain embedded within oversold territory longer than most can remain solvent…and,
4. i don’t trade stochastics – i trade “price action”.
I’m with you RTV…
My wife told me to get out of my shorts today…
And I also closed my entire HGD.TO position…?
Why don’t smileys work here?
I’m with you RTV…
My wife told me to get out of my shorts today…
And I also closed my entire HGD.TO position..hehe.
The full stochs look decent on the closing price chart.