More Cycles in Gold…looking for a High?
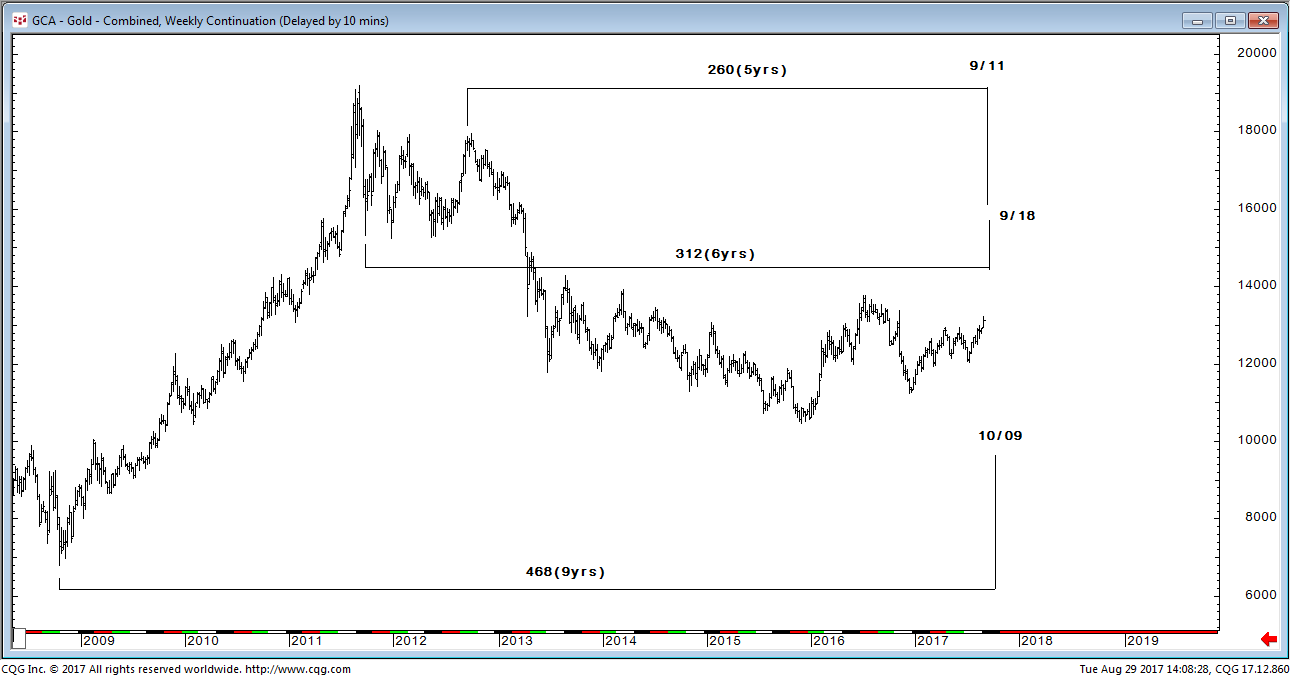
Relevant potential time turns are indicated by an alignment of 4 or 5 or as many as 8 or more coincident time terminations of annual anniversaries from previous market highs and lows which are usually accompanied by important Gann cycles. The following weekly chart below illustrates this. We have a 5 and 6-year measurement both due in September and one of 9-years due in October. We would not ignore them but they are few in number and were not accompanied by any Gann cycles.
We then moved to a daily chart which follows below. Our findings here were somewhat surprising given there were very few time observations on the weekly chart. On September 11, two (red) Fibonacci golden sections and a (blue) low-to-low measurement in time will terminate coincidentally. Low to low price intervals tend to project to a high more than to a low. Ironically, we then looked up the date of the all-time high in gold futures. It was September 6, 2011, 3 trading days earlier than the September 11 date, definitely not something we would consider as a random coincidence.
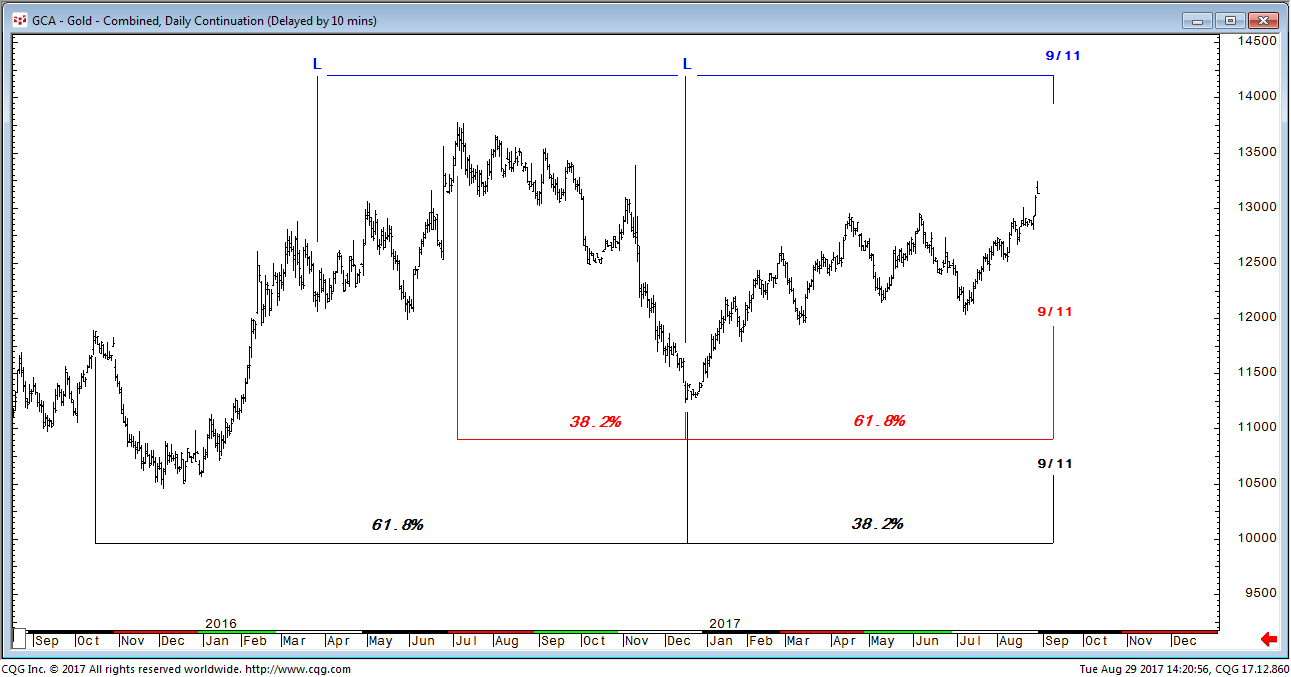
We must therefore consider that there is a good chance for a market turn in the foregoing period.
Note that we did not write a “high” or a “low.” Were prices to experience a correction into the week of September 11 plus/minus one day, a low would be more probable. An immediate continuation of the move higher would obviously be a warning of a high.
Boo Boo Man…this is over my head…please let us know if this is your original work or if NOT who is to be credited
tia
OK …I re read it…I get it…this is very interesting thanks !
Thanks. Guess I need to re-read it also.
I’ve studied technical analysis since 1978 and I’m quite familiar with Fibonacci time projections and with most of Gann’s Cycle Theory. And while I can easily understand these two charts let me say that I’d rather trust the work of two of my career professional friends, one of whom did these two charts.
I run three studies on Metastock that have proven highly reliable and all three remain on Buy Signals at the present, although it wouldn’t take much more “correction” for one of them to issue a sell on the December ’17 Comex Gold contract. Looking at Surf’s work on the Dollar Cycle, together with the chart studies above leaves me as nervous as a long-tailed cat in a room full of rocking chairs!
IF we correct further over the next few trading sessions we may then get a rally into the September 11th time frame where a high is likely; if we get a real sell-off (to about $1260 + or -) then the expected turn could well be a low. But if Surf is right about the Dollar – and my work appears to support his call – then we are looking at a high in gold of probably an intermediate degree.
I truly hope my fears are wrong, but they’re not unfounded.
Thanks very much Boobooman for this work and explanation. Much appreciated. Very Interesting and potentially Sobering
Sept 11 ?
sheesh
You are correct BooBooMan the 09 Sep is important (or should we say 08-11 Sep given the 09 Sep is a Saturday).
It is the date I have for the topping of the SPX in the final left translated failed daily cycle before we host a YCL late Sep-early Oct.
At the same time I expect the half cycle correction in gold to be complete by that date and it should move higher.
I mentioned this in Northstar’s recent post… https://goldtadise.com/?p=411023#comments
I expect the USD to continue lower until late Sep after gold has completed this half cycle correction.
Thanks for checking in Sir Norvast of Gann Was thinking this post would get your attention.
Interesting perspective.