To Da Moon Vs Cautious Optimism
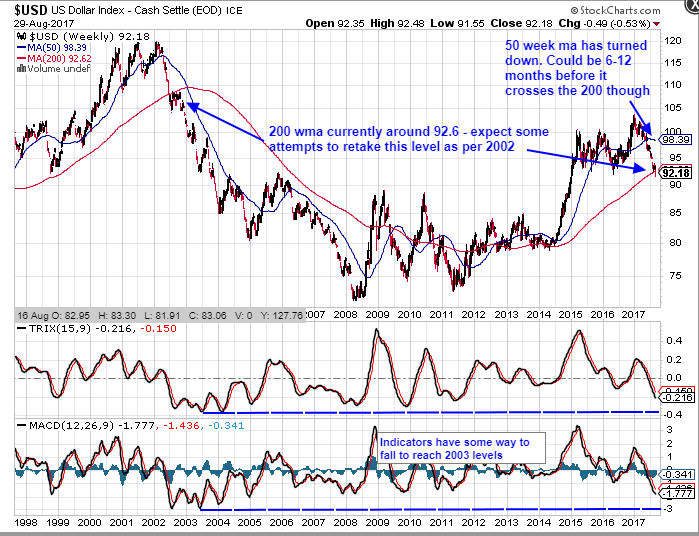
All joking aside, (and pictures of rockets blasting off). I keep saying ‘as we go up, keep looking down’. With that in mind, I’ve got a couple of charts here, with some simple notes on them. It’s really interesting to see the dollar trying to regain its 200 week moving average as I type. By the way, I mistakenly typed ‘dma’ the other day, when I meant ‘wma’ – apologies for that. Anyway, back to the point – if the dollar fails to retake and hold that crucial level, it will open the trapdoor, back to the 80 region, as Spock, Graddhy, and others have been saying for a while.
At the same time, gold is battling to hold above the $1300 area. Personally, I’m happier that this ‘battle’ is taking place today, rather than tomorrow. The monthly close is all important from a technical, charting perspective of course. With such quick moves, gold needs to work off some short term overbought indicators, with the dollar doing the same, but from an oversold point of view. Longer term charts all show the indicators some way to go before being overbought on gold or oversold on the dollar, as you can see below.
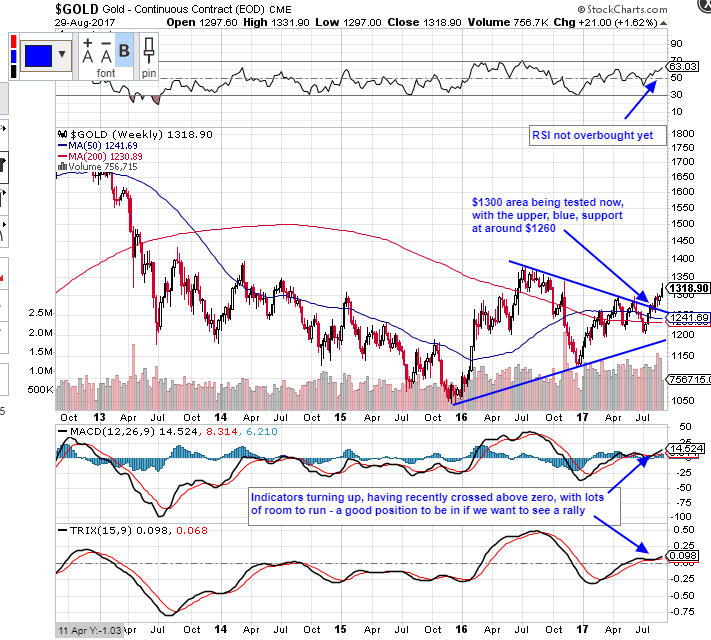
All we can do is let this play out. Once that triangle is in the rear view mirror, we can relax a little more. The bullish triangle in gold is much bigger than what I’ve drawn on the chart above, of course – I’ve just drawn the ‘important bit’. Once we get into the upper $1300’s and particularly the $1550 area, we can start to make some realistic assessments about how high we might get in the next few years. Once the direction of travel is fully confirmed, we can have another look at targets. My view is that we will easily make $1550, with $2500 highly likely, and then much higher targets with a low confidence level at this point So far so good. Lets see what the rest of the week brings.
Northstar
Gold hosted a DCL on the 15 Aug and will now pull back for a half cycle correction which I think will be a small “double bottom” on 04 Sep and 08 Sep, after which it should move significantly higher for 3 weeks as the SPX falls into it’s YCL.
I am expecting the next DCL for gold 27 Sep and the following one 07 Nov.
My interest lies in whether this weekly cycle will be right translated from the ICL on 10 Jul
This half cycle correction over the next few days is a buying opportunity for anyone not set with miners as I expect considerable upside through Sep.
As discussed previously the lead indicators are AUD, CHF and Copper and all hosted DCL/ICL on 15 Aug along with gold.
I agree that $1550 is a very important area (for those that were following gold in 2013 when it dramatically moved through that zone).
Good post again – thank you!
Thanks for your comments Norvast. Noted, and appreciated
Just out of interest Norvast – are you expecting a pullback all the way to the $1260 support area ?
I would be surprised that the pull-back in a half cycle correction would be of that degree.
The SPX will move lower into the Full Moon 06 Sep and gold will bounce then fall back for the “double bottom”.
These are pretty exciting times – first genuine “safe haven” advance in gold for some time!
Time to look at the minnows and explorers in gold & other commodities.
Remember gold will lead…look/compare the charts for XGD.AX (gold chart Aussie miners) and BHP.AX (large diversified miner and big copper producer) and you will understand why I was buying gold miners in late 2014 and diversified miners in early 2016
Thanks for that. Yes, I’m pretty well loaded up with Spocks rocks, along with a handful of larger producers for good measure. Currently up 360% with Sandstorm Gold, and up on most of the Uranium miners I hold as well (about 30% in the case of Mega Uranium) – thanks to Graddhy for drawing my attention to that sector. I was quite lucky, taking most of my positions around HUI 120. As you say, exciting times ahead I think (just hope things don’t get too bad politically).
Thanks Northstar. Kinda miss the rocket. How about sound effects for your next launch
Ha ha, maybe an impressive ‘woosh’ and a ‘yee ha’
Excellent. Thank you very much, indeed.