And Another One Is Breaking Through Today
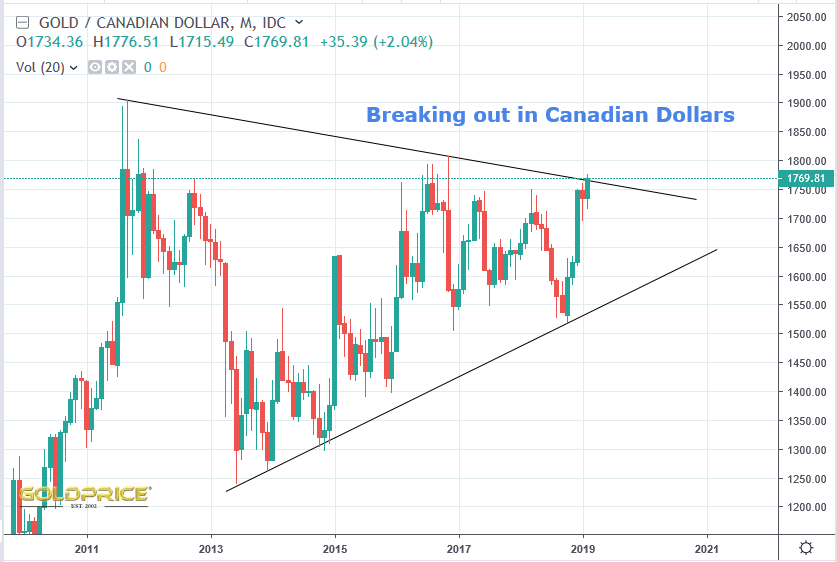
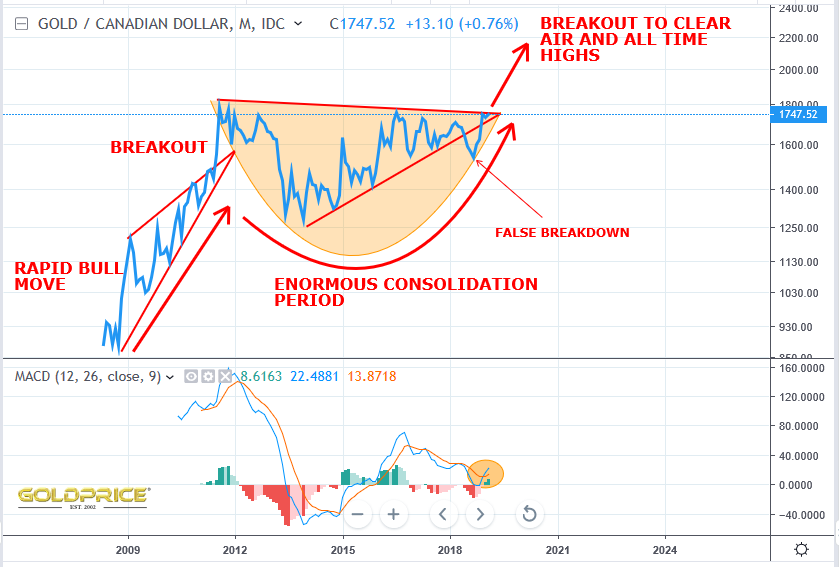
Gold in Canadian Dollars…
Stand by for the institutional buying and surge in the mining indices.
Gold in Canadian Dollars…
Stand by for the institutional buying and surge in the mining indices.
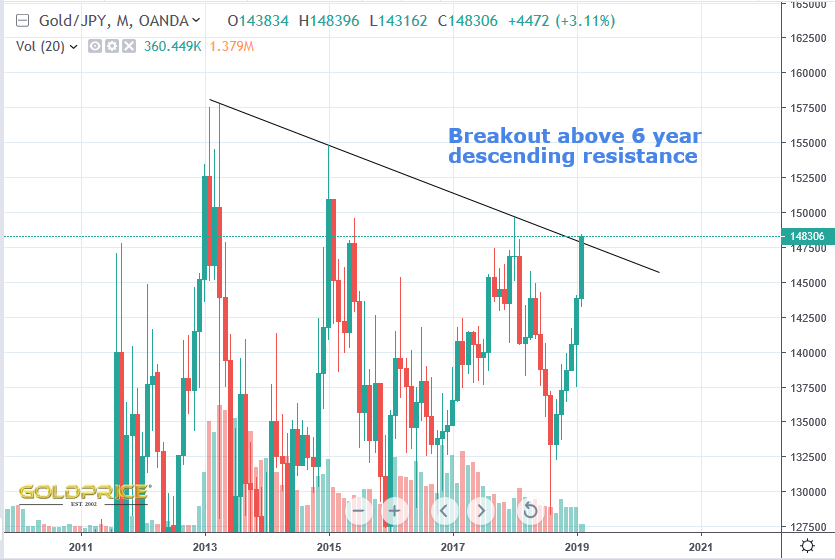
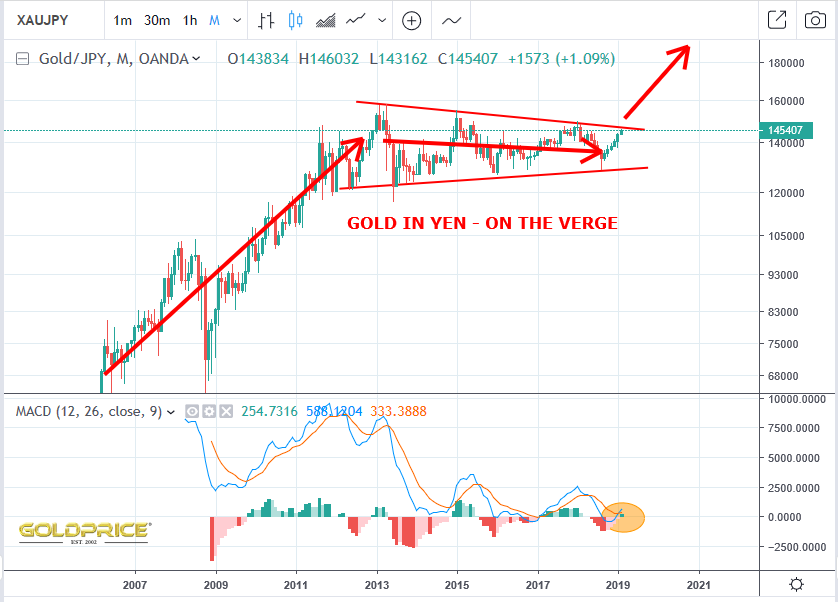
Another one to add to the rapidly growing list of global gold breakouts – the Japanese Yen. This is going to cause a surge in gold buying and investment in PM shares.
Still some way to go. Breakout somewhere between 190 and 200 (but declining)
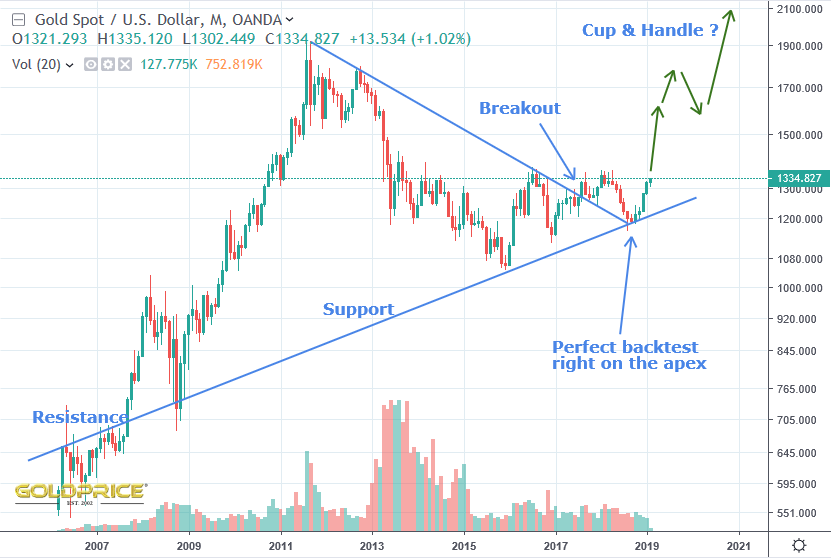
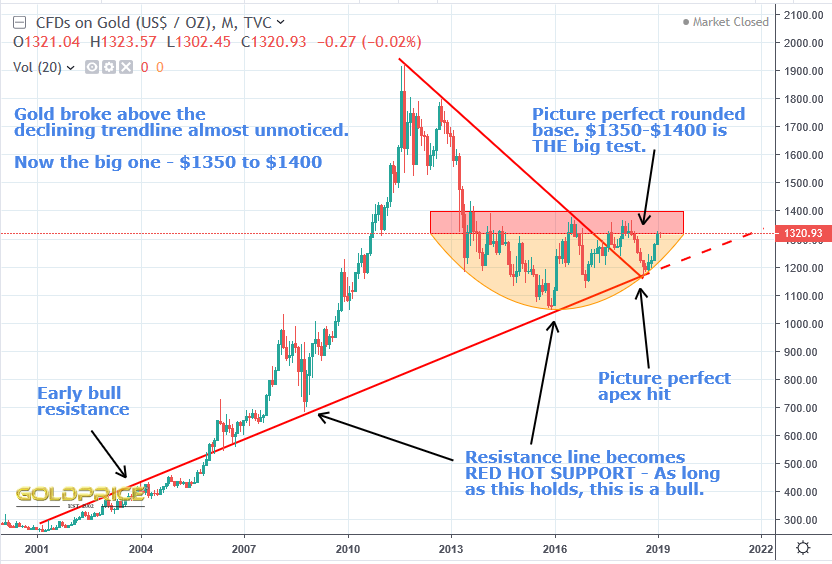
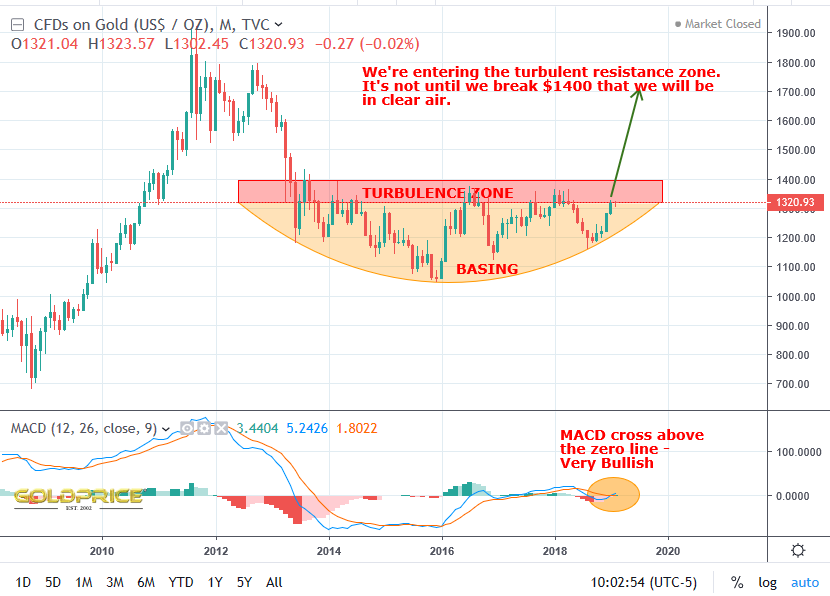
I’m not going to declare the battle is won until DXY climbs clear of $1400, but the evidence that supports that outcome is building. The rounded base breakout is still ahead, but the log chart wedge breakout looked beautiful, complete with a perfect apex backtest. The cup and handle pattern is pure speculation of course.
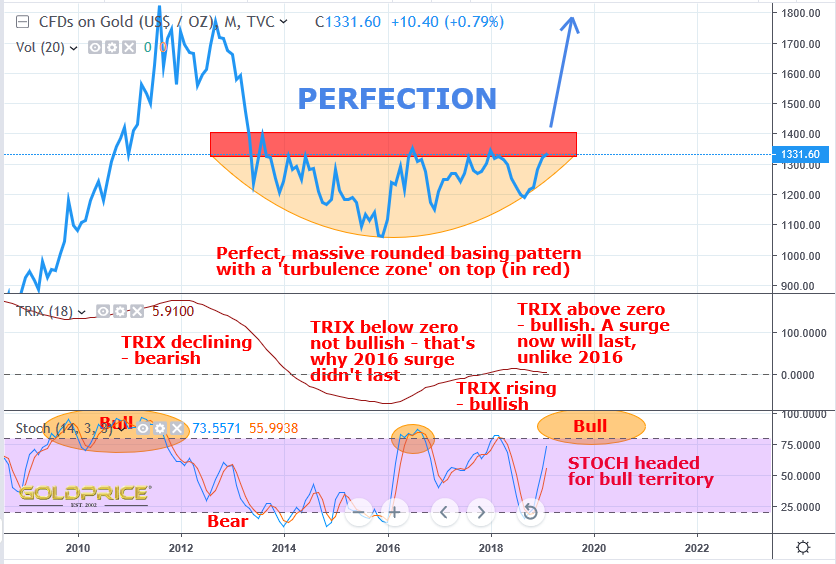
It’s happened in many global currencies already. The USD basing pattern is the prettiest of the lot. A perfect rounded base, with a ‘zone of turbulence’ on top (in red). At some point in that red zone, we’ll hit a ‘point of recognition’ and PM stocks will catch fire again.
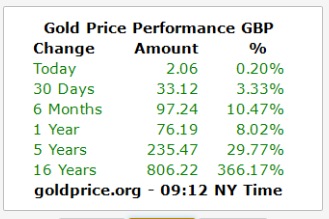
Here in the UK, we’re green across the board now…
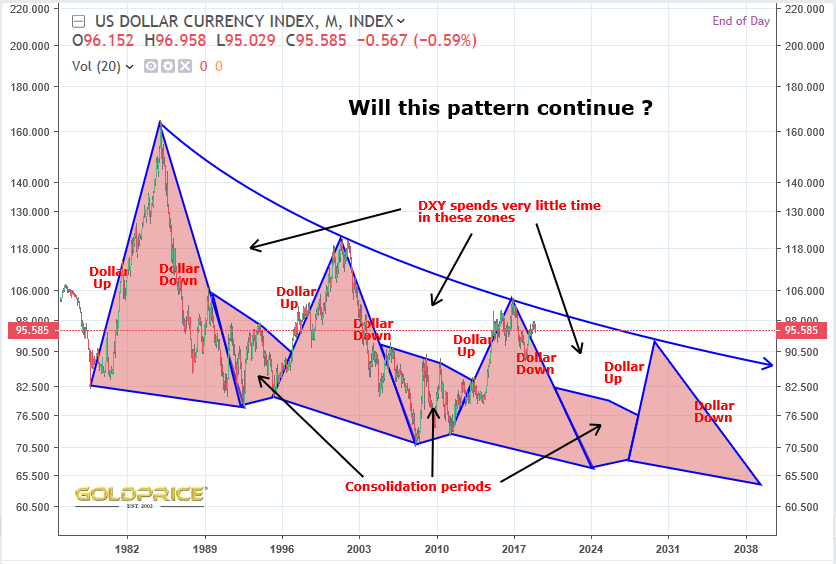
Back to DXY, we can zoom in a bit and see some possibilities…
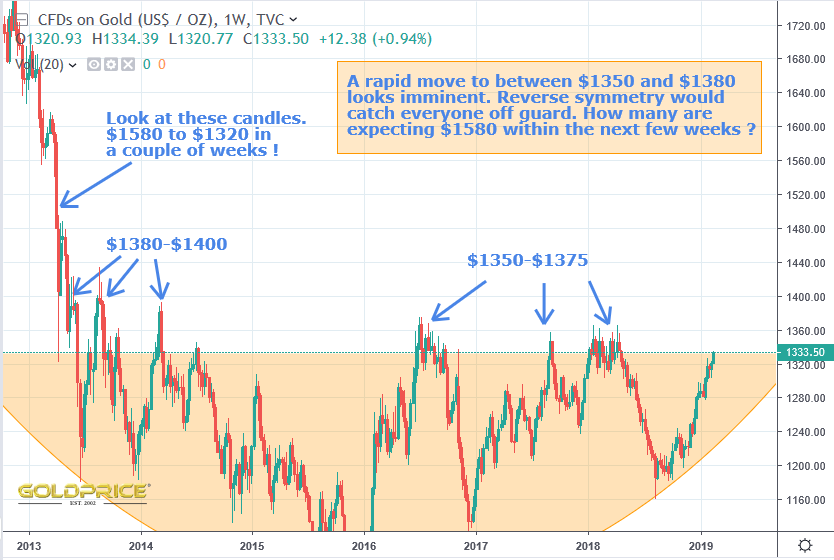
As I’ve said recently, this either takes off as I’m expecting, or it’ll be the biggest failure since the chocolate fireguard 
Whist everyone is fixated with gold in US Dollars…
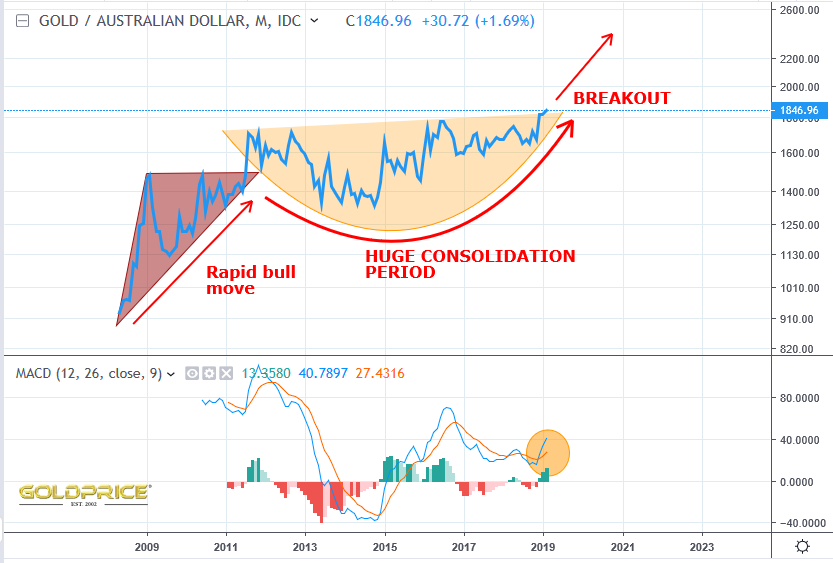
AUD – New all time highs
CAD – we just need approx. $1775 for a 7 year wedge breakout ($1760 as I type)
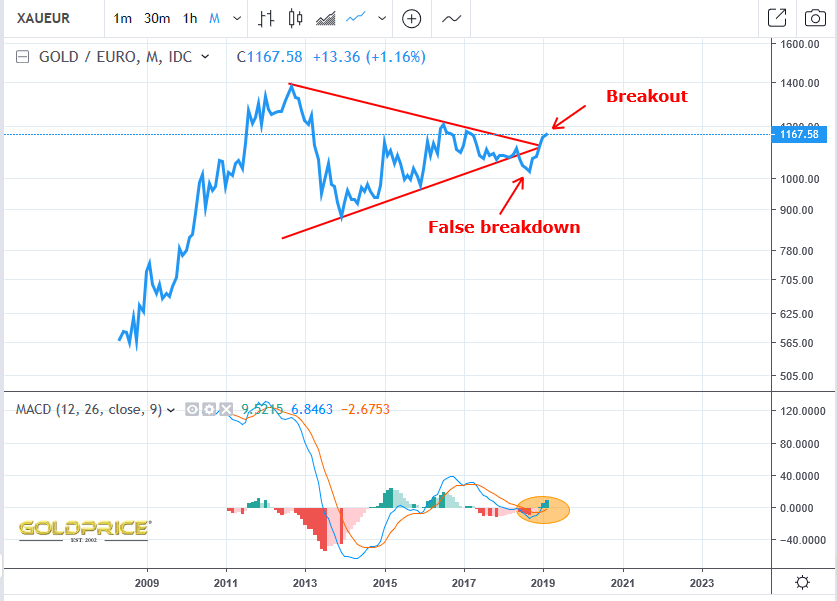
EUR – We have broken up and out of a 6 year wedge
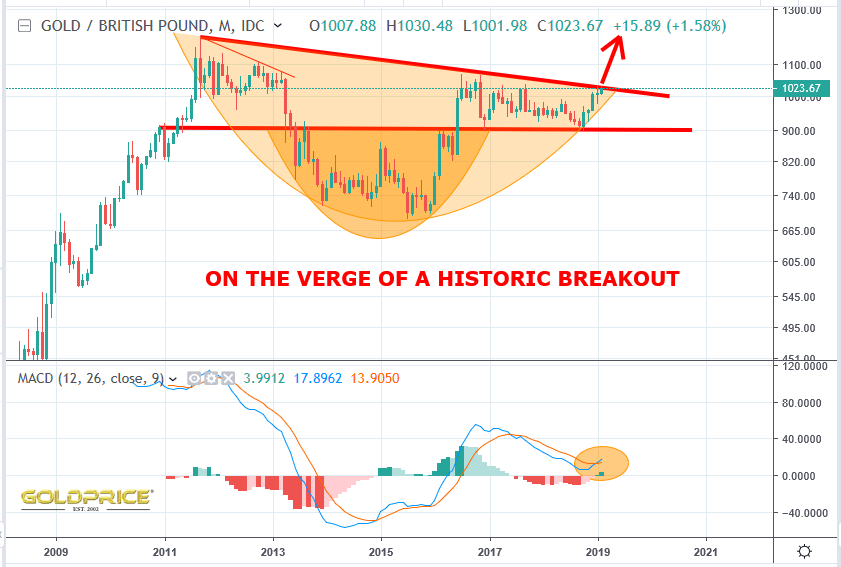
GBP – We have broken up and out of a 7 year wedge
INR – We have broken up and out of a 5 year wedge
JPY – Right on the verge of a breakout of a 6 year wedge
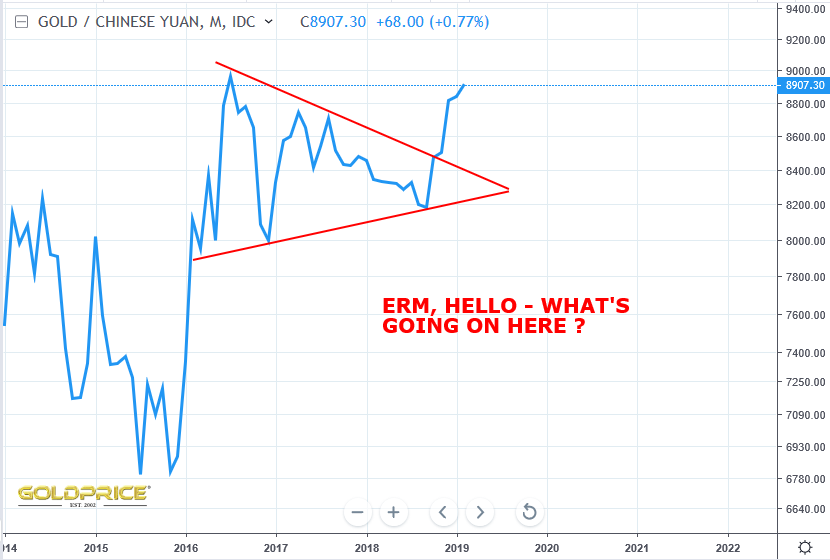
CNY – We have broken up and out of a 5 year declining resistance line and are now about to break horizontal resistance
TRYG – Turkish Lira didn’t experience a bear market
NZD – New all time highs
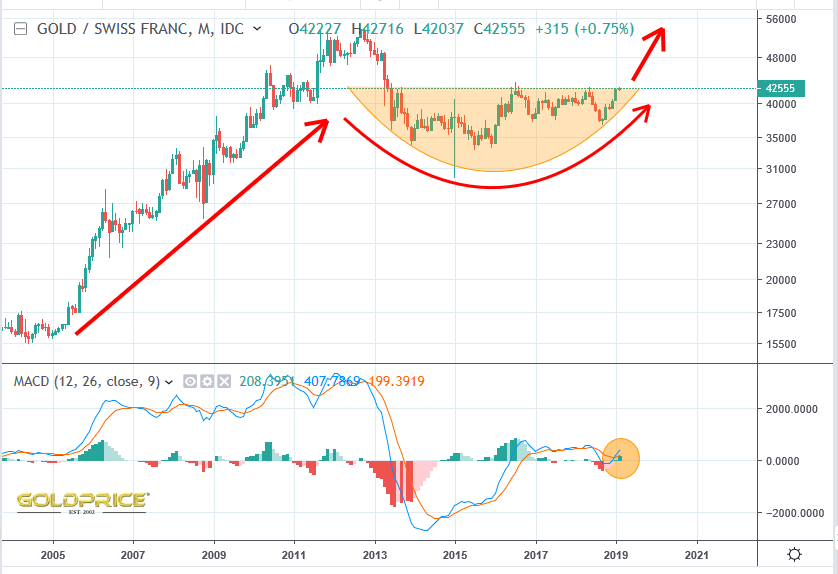
CHF – We have broken up and out of a 6 year declining trendline. We then had a perfect apex hit where this intersects rising 10 year support. Price now rising fast.
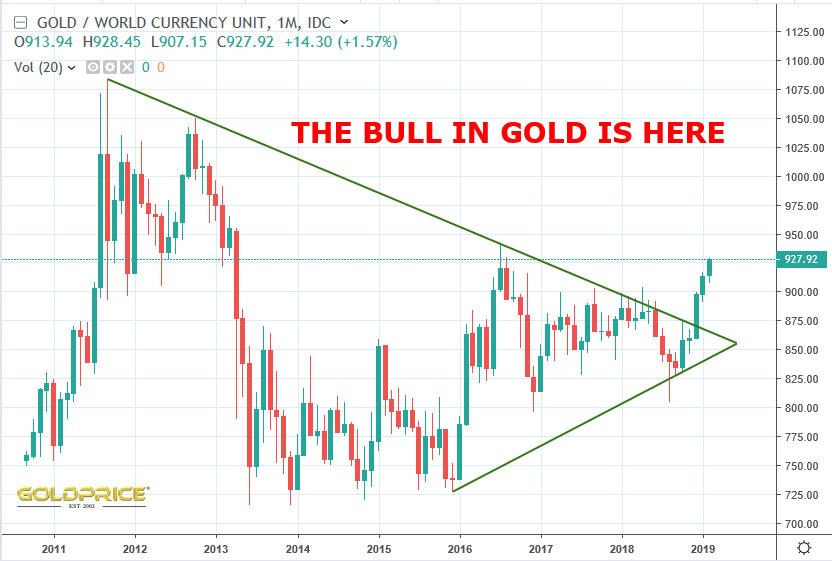
Still need convincing ? Consider gold priced in the World Currency Unit https://en.wikipedia.org/wiki/WCU_–_World_Currency_Unit
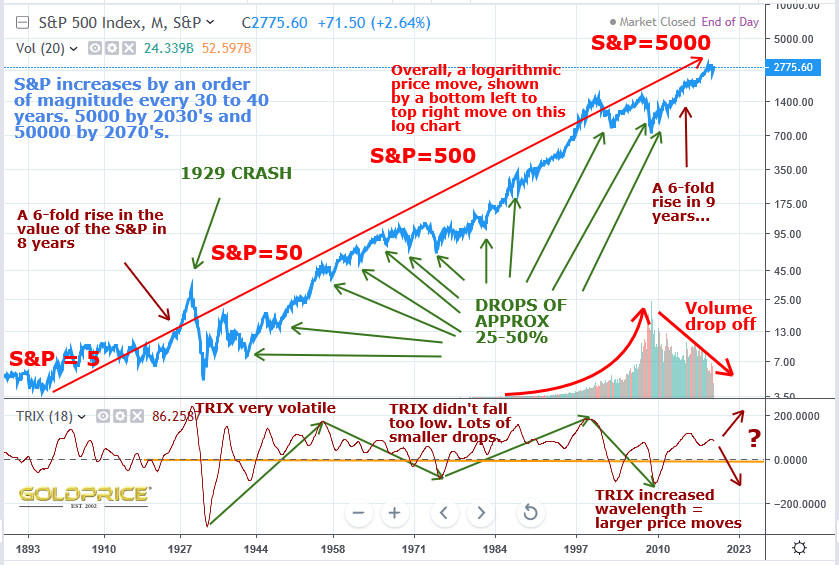
I don’t often look at the S&P. I just remembered why – I don’t like it’s chartology. It’s a slippery little snake that seems to just want to keep going parabolic (a straight line from bottom left to top right represents a parabolic price rise on a log chart). 50,000 here we come. Question is, do we get a 25%, 50% or 90% correction before then. Damned if I know, but here’s the chart…
Two patterns. One broke out a while back. The other is about to be tested. Bull ? I think so 
Following on from Fullys excellent point earlier. Log charts are essential for tracking long term prices. Why ? Because over time, measured in FIAT currency, everything is appreciating logarithmically. What do I mean by that ? Everything is increasing in price by orders of magnitude. For example, a house here in the UK used to cost a few hundred pounds, then it was a few thousand pounds, then it was a few tens of thousands of pounds, now its into the hundreds of thousands of pounds. That’s the definition of logarithmic – you have to add an extra zero at regular time intervals. Witness the price of gold in Turkish Lira…
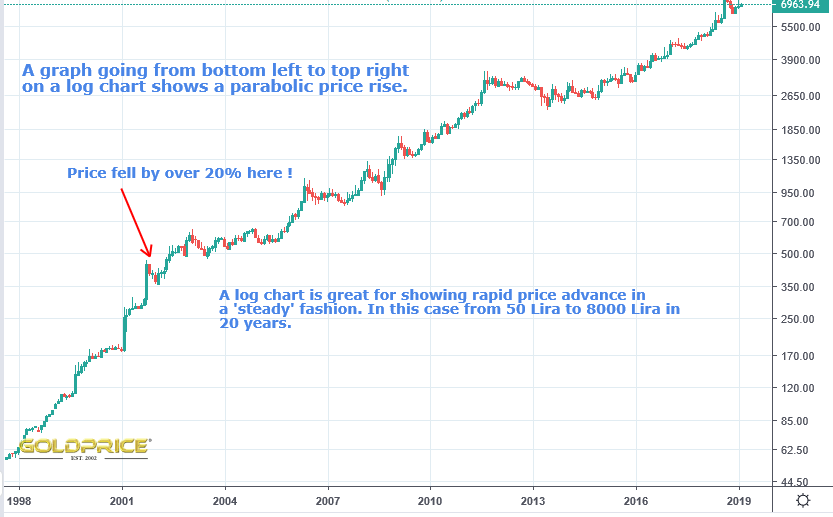

This is exactly what is happening not just to the Turkish Lira, but every FIAT currency on the planet. For those of you in the US, think about the price of a house at the turn of the 20th Century, then in the 1950’s, 1980’s and now. Logarithmic ? You bet.
OK, so I’ve shown that gold is breaking out in front of our eyes in all major global currencies. The chart in US Dollars might be the last one to pop. Here’s where we are now…
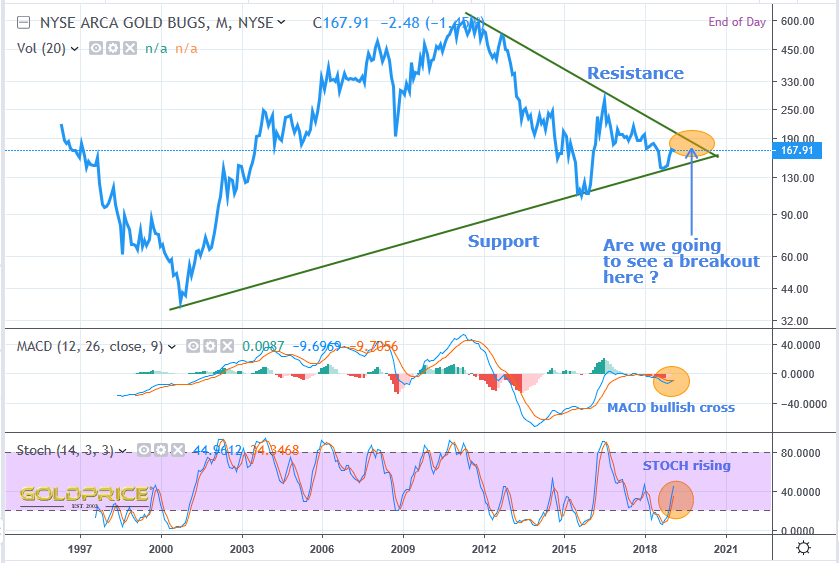
Lets take a look at gold stocks. I’ve picked GDX, but it’s the same argument for GDXJ and HUI…

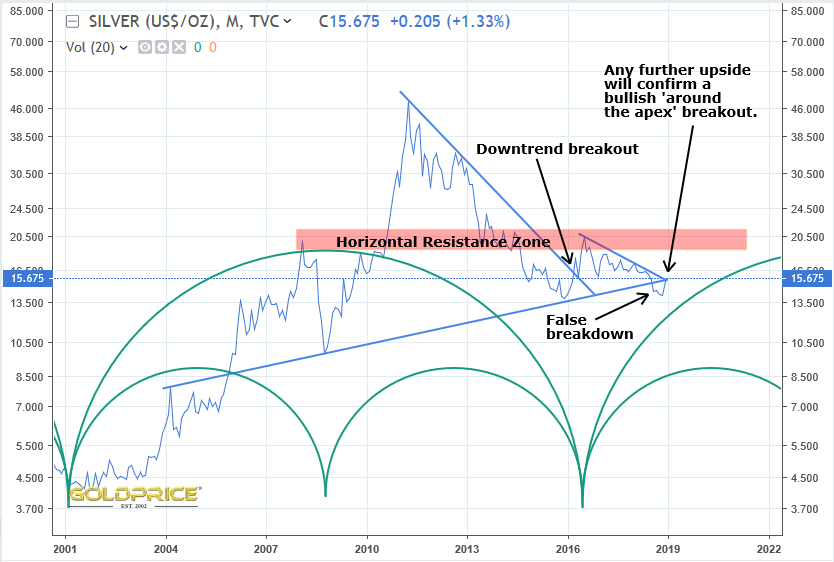
So I would be adding to my holdings on the basis we broke above declining resistance in the 21 area. For the record, I went all in when HUI was around 120 in early 2016. Since then I’ve added some Uranium holdings, and a few other random stocks which struck me as good value. As you can see above, gold stocks have a huge amount of catching up to do. They need to rise another 30% to find themselves in a similar position to gold itself. If you are very cautious/bearish, you might wait until we break through that 32 region. A better policy would be to enter when gold clears $1400. GDX should still be well below 32 at that point, but I would view $1400 as a ‘point of recognition’. When we reach that point, I expect PM stocks to make very rapid advances similar to 2016. Here’s a look at the silver chart…
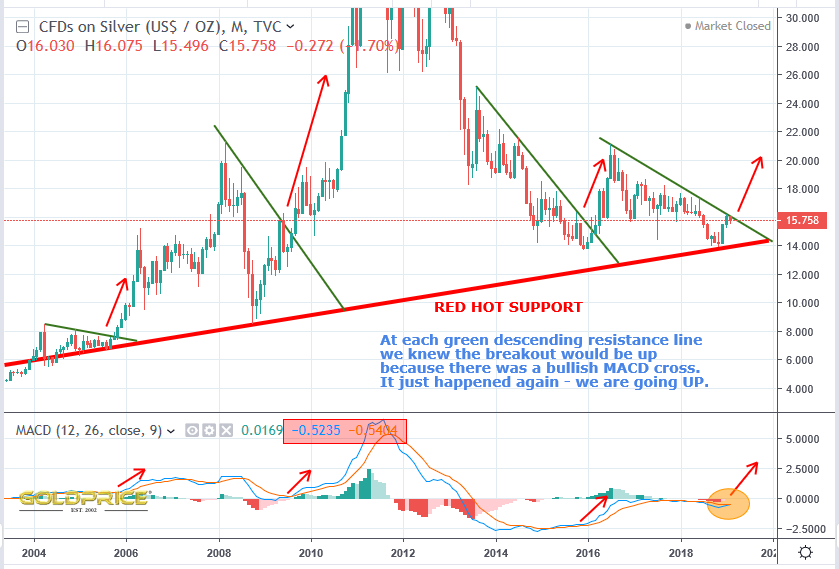
That, to me, is one incredibly bullish looking chart. I see little reason why we can’t be approaching $20 later this year. Seriously, this is unfolding right in front of our eyes and it’s getting little or no attention. That’s good, very good. I would hold tight if you already have a position, or if not, I would start to build a portfolio at the $1400 breakout, and only sell if we were to move back below the ‘turbulence zone’ marked on my chart. In terms of which companies – I would stick to those listed in the HUI/GDX/GDXJ. I study the individual chartology and try to read as much as I can about the way the company is managed. Personally, I would spread risk across at least 20 miners, so that if one were to go ‘tits up’. it’s not the end of the world. Could we see a total failure here, with gold plunging to $1000 or less ? In a word – yes. I view that as very unlikely though. This has all the hallmarks of the next stage in the PM bull. Good luck to you all.
I usually keep a closer eye on gold priced in other currencies. No matter – at least we all now know that gold is popping across the planet. Canadian Dollars, Aussie Dollars, Euro, British Pound, Swiss Franc, Japanese Yen and Chinese Yuan. Breakouts are happening as we speak, and have already happened in many major global currencies. Does this leave us in much doubt about what is going to happen for gold in USD ?
Now this one has to be pretty important, right ? Surely if it had broken out we’d have heard about it. Apparently not…
This one is breaking out as we speak
You guessed it – on the brink of a breakout.
Canadian Dollar gold chart. All the classic chart patterns are there – bull run including breakout of wedge – massive consolidation and base building – false breakdown. Now we’re on the verge of an enormously significant break into clear air and new all time highs. Does any of this sound familiar ? Look at the gold chart in US Dollars. All the charts are saying and doing the same thing. One by one they’re breaking into a huge new bull market. Gold in USD may be the last to pop, but after looking at all of these, I for one am more confident that $1400 is going to be tested and overcome soon.
After a false breakdown, we have the classic ‘around the apex’ breakout. Hugely significant, but the silence is deafening !
All time highs. Again, nobody seems aware of what is happening here, and just how important it is…
Gold is pennies away from an enormously important breakout, and nobody seems to care. This is a perfect contrarian indicator as far as I’m concerned. Looks at that MACD cross as well…
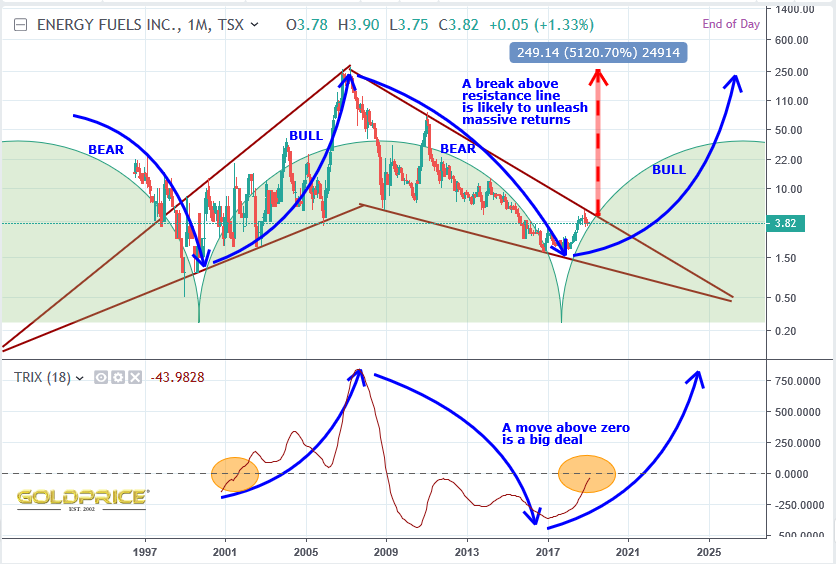
Well, if history is any guide it could be for Energy Fuels
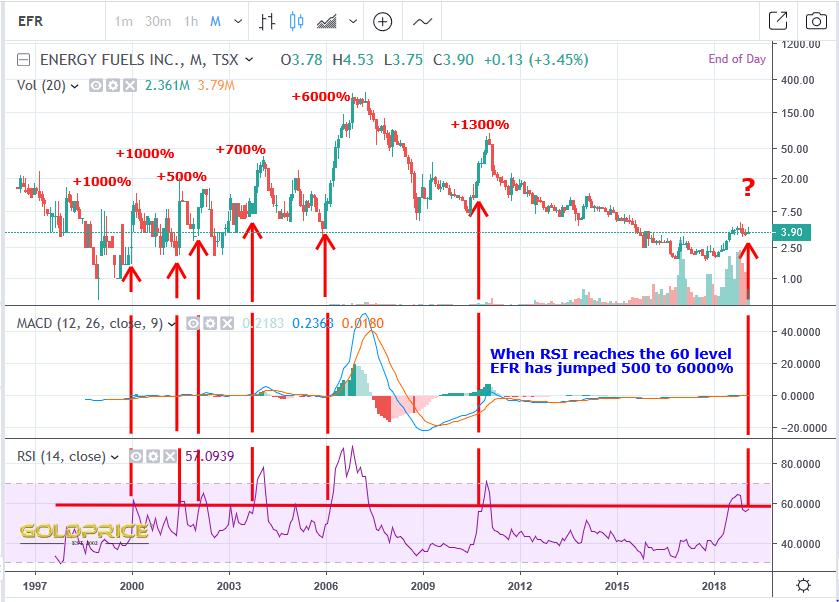
This isn’t a confident prediction, just an observation of past behaviour. I’m holding this stock, with a 100% gain so far. My target price in the next 12 months is $10. As always, do your own due diligence. Uranium stocks are incredibly volatile.
Which way ? I like Avocados chart. It keeps me alert to the possibility of a huge dollar rally. What stops me from thinking this is the most likely outcome is time. We’re running out of it. Everything else seems to be pointing to a breakdown. The megaphone pattern is very significant. It tells us the market is very unsure. It’s most common at major, cyclical tops or bottoms. A top or a bottom can be ‘V’ shaped or it can be a long, drawn out topping/bottoming process. To help decide whether we’re forming a top, or a base to launch from, I’d say that the time factor is key. Where are we in terms of the larger cycles ? Are we approaching a major cyclical top, or should we be turning down ? Gold looks to have formed a massive, and I mean MASSIVE 5 year base. A move above the $1400 area will be decisive. At that point, I believe PM stocks will go nuts, probably more than doubling within 6 to 12 months. Individual stocks could easily go up by 400 to 600%. We’re not there yet though. A rapid move to above 110 on the dollar ISN’T impossible. In my view, taking the signal from gold and cycle timings into account, it’s a low probability (maybe 10 to 15%). As Fully has said, gold can rise along with the dollar, and certainly needs to start showing relative strength. However, a 20% rise in the dollar would likely kill any hopes of a gold breakout for some time. Also worth remembering, is the fact that gold is already breaking out from multi-year downtrends in other currencies. I’ve tried to summarise a lot of this on the chart below.
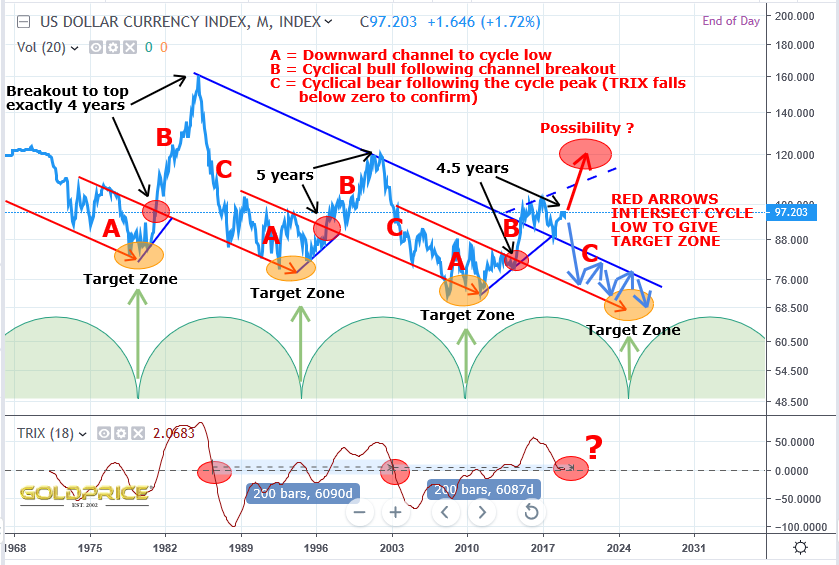
I have to admit, this is taking much longer to resolve than I anticipated. As I type, the dollar is having yet another attempt at the 97 level. It must be pretty bruised – how many rejections can it take ?
We’ve built out a large megaphone pattern, with higher highs and lower lows. My thoughts are in the chart below…
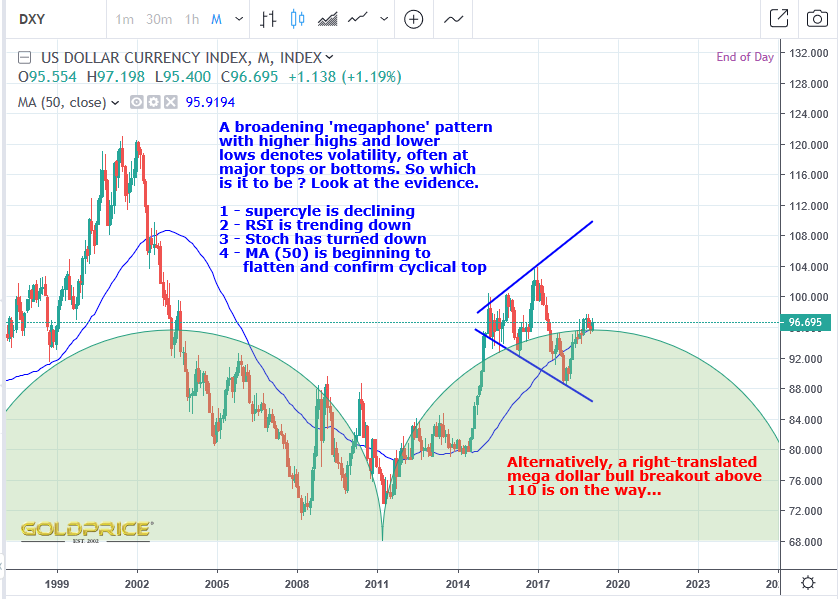
Something has to give. The volatility suggested by a megaphone pattern is strongly suggestive of a market trying to find direction. When it does and there is a breakout, I believe it will have enormous implications for global markets. I think the next big move (whether it’s up or down) will be the final one in this pattern. That means we either go above the 109/110 area in a huge bull move, or we drop below 87/88 and we have a full on bear market.
I think the FED could prove to be the key here. Interest rates, as I’ve said before, are closer to the end of the hiking cycle than the beginning (in my view). That (again, in my view) is dollar bearish. Think about it. 22 trillion in debt. How much higher can rates go without causing a debt fuelled collapse ? There is very little room for manoeuvre. They appear to be boxed in, with only one way to go. That may please investors at first, but the full horror of the implications will soon make themselves felt as it becomes very, very clear that the Emperor has no clothes (no policy options) except more low or even negative rates. This monetary farce has always been doomed to failure I’m afraid. It’s simply a question of when.
One step at a time…
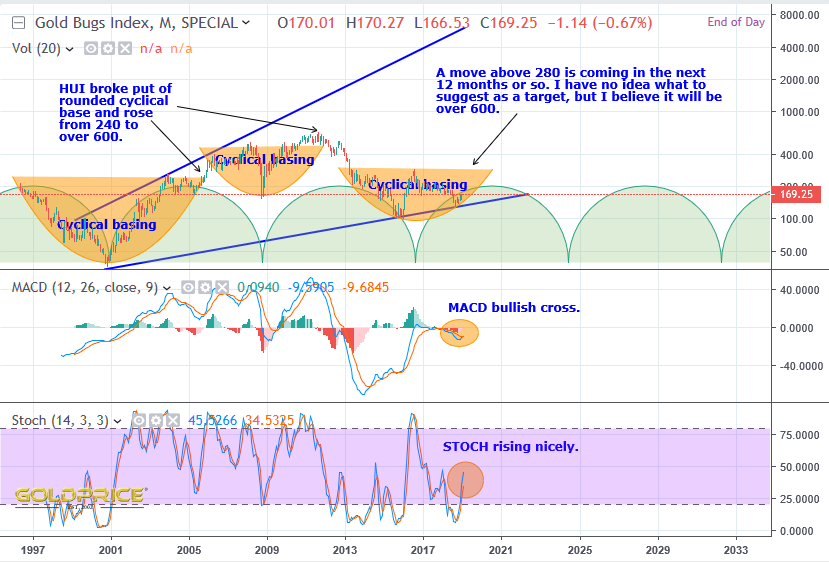
A bullish MACD cross combined with STOCH rising from below 50 to above 50 has delivered gains of between approximately 180 and 300 points on the HUI this century. The HUI chart is on the brink of delivering that bullish signal again…
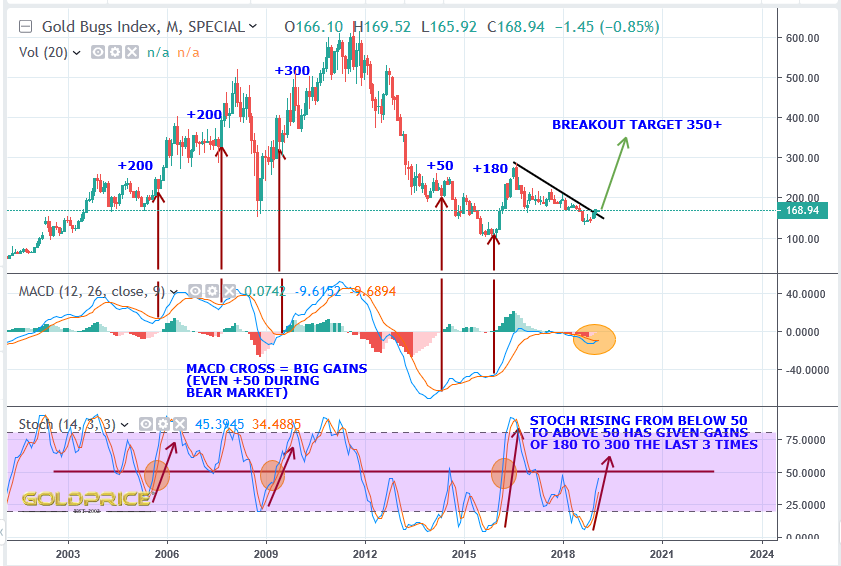
The HUI is just about to finish it’s third cup since the turn of the century…
I got into this one at a share price of around $1.80, so around 100% profits at the moment. I’m holding though. A break above the $5 area, with TRIX crossing above zero, at the same time as we move out of a cyclical low will be enough to suggest some very big gains ahead. 5000 % anyone ? Do your own due diligence as always…
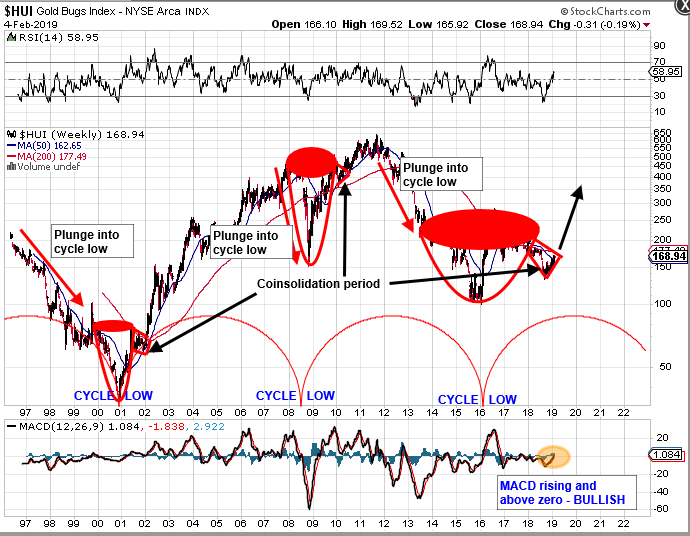
History repeating…
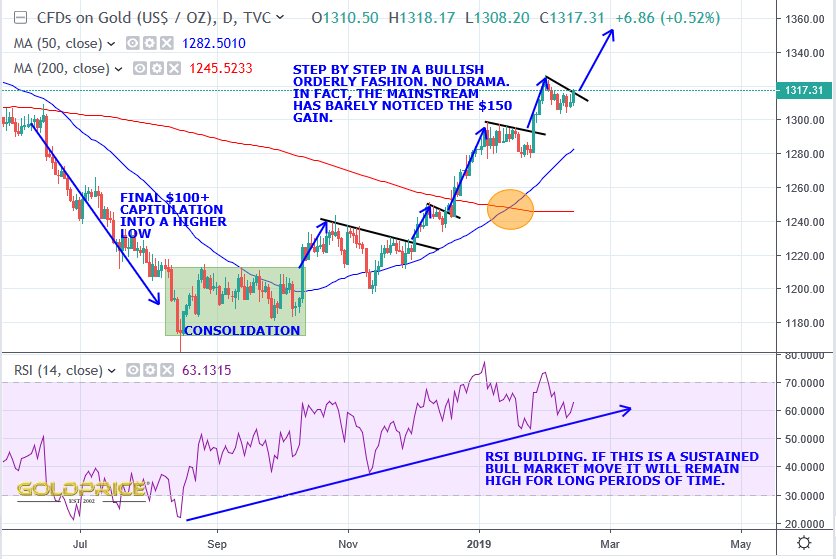
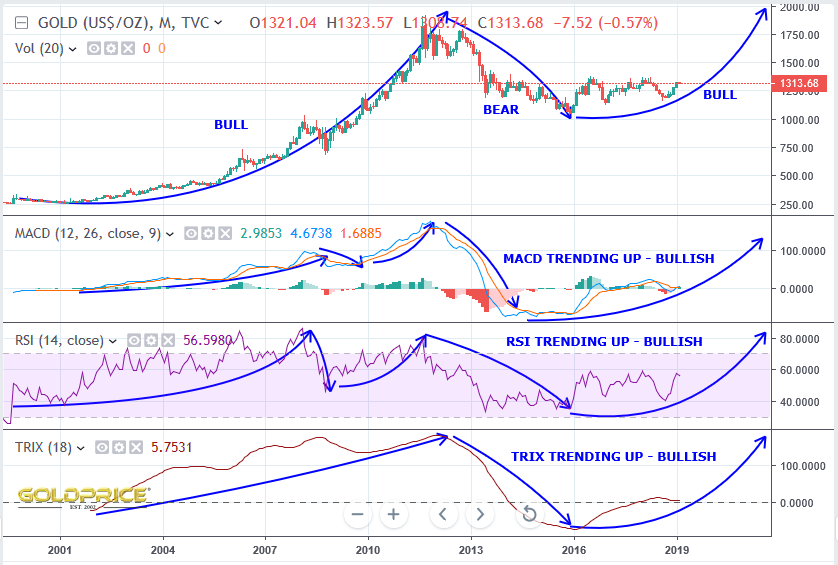
Gold chart indicators are looking good
The topping process was very different during the most recent cycle peak. RSI typically takes 3 years to bottom out (the dollar continues to fall for some years after that). For this cycle, that initial 3 year drop comes to an end in December. If I’ve got any of this right (and it’s largely based on pattern recognition), it means that (compared to the last 2 dollar cycles), the drop from the peak so far has been pretty small. Does that mean there is some ‘catching up’ to do ? Does it mean we’re on the edge of a very rapid 10 to 20% drop ? I’m thinking maybe it does…

Here’s what…
I’ve been speculating about this chart pattern for some time now (massive wedge breakout, apex backtest, rounded bottom, ‘hot zone, $1410 region breakout). The symmetry and chartology is perfect. Each element is working to confirm the direction (up). That hugely important bull market support line was tested and held successfully. The wedge breakout was tested at the same time and resulted in the most perfect apex hit you’ll ever see. On top of all of that we have a perfect 6 year rounded base (perfectly positioned at the major cyclical low point), allowing a steady build of market energy and forces which, I believe, will launch gold prices through the hot zone and clear above $1410 in the next 6 months (probably much sooner). At that point gold stocks will be on fire.
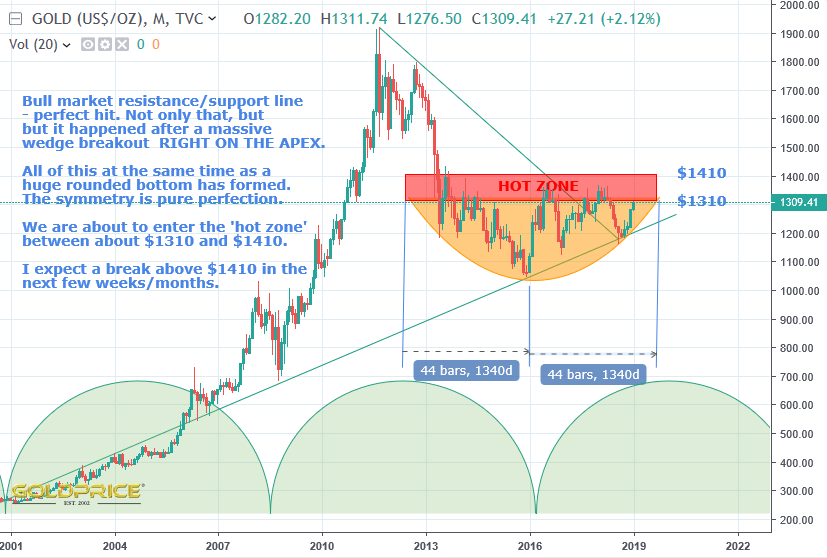
That’s how I believe things will unfold, but for the sake of completeness – a break below the $1220 area means it’s time to give up. Come on gold, you can do it…
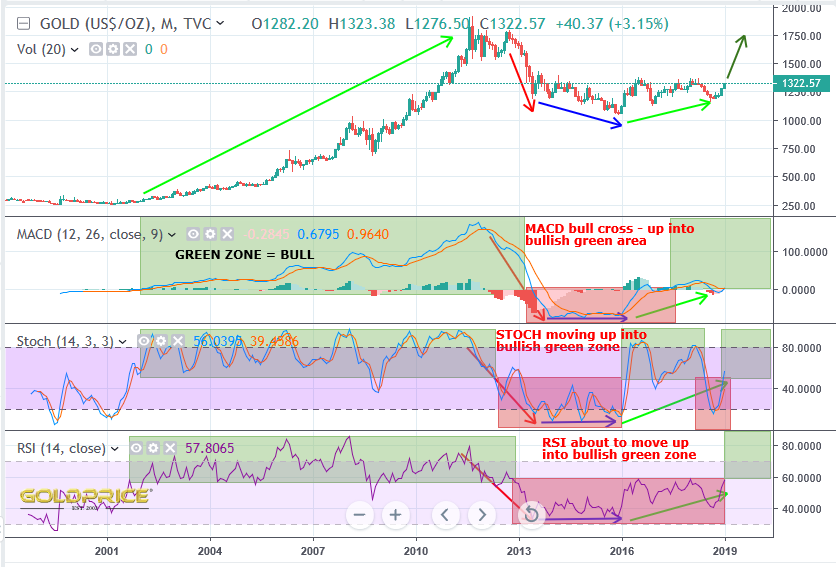
Continuing the ‘picture paints a thousand words’ theme…
A picture can paint a thousand words, so here’s a picture…