S&P
I don’t often look at the S&P. I just remembered why – I don’t like it’s chartology. It’s a slippery little snake that seems to just want to keep going parabolic (a straight line from bottom left to top right represents a parabolic price rise on a log chart). 50,000 here we come. Question is, do we get a 25%, 50% or 90% correction before then. Damned if I know, but here’s the chart…
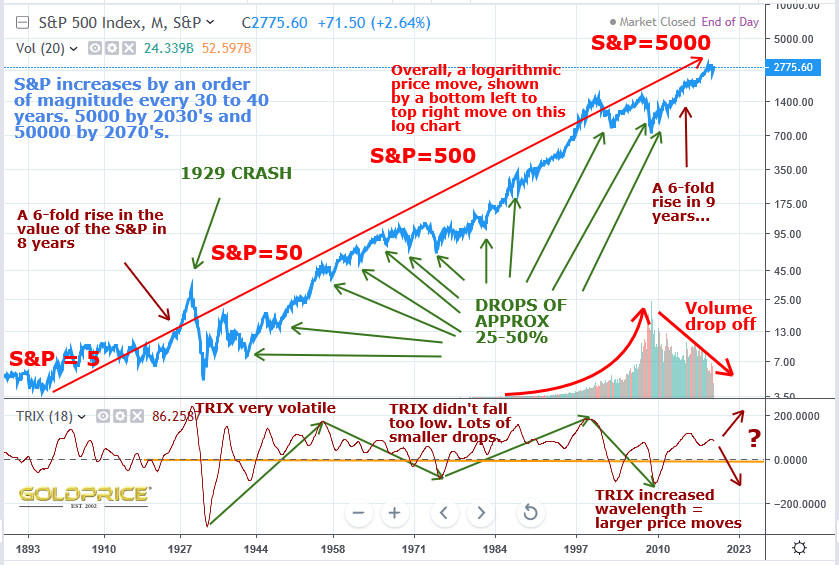
The reason it looks parabolic (logarithmic actually) is simple. Inflation is logarithmic. At 2% per year, year after year, that is by definition logarithmic. It is why so much of the value of a dollar has disappeared over the last 100 years.
Absolutely spot on Ken. In time, everything priced in a FIAT currency (houses/cars/stocks) will rise parabolically. That’s why every FIAT currency is doomed – they all reach an end stage due to debt and lack of faith. Paper, after all, is worth nothing. The US debt is 22 trillion (actually a lot more, but that doesn’t matter here), it’s going to blow up…tick, tock, tick, tock…
I agree with you. The stock market may not protect you from real inflation but does a good job of keeping up with nominal inflation. I think that explains the chart more than quality of earnings or the economy overall would. So as an inflation hedge,I think it’s worth it to be in. To me, I think of it as an alternative and often better way to hold cash.
Good chart Northstar! I’m always surprised by 100 year charts of the Dow or S&P500. The Incredibull Stock Market: surviving depressions, world wars, world reserve currency transitions for more than 100 years…
I think it was Ludwig Von Mises (prominent Austrian School economist) who said that the sign of a civilized species is a functioning stock market 🙂