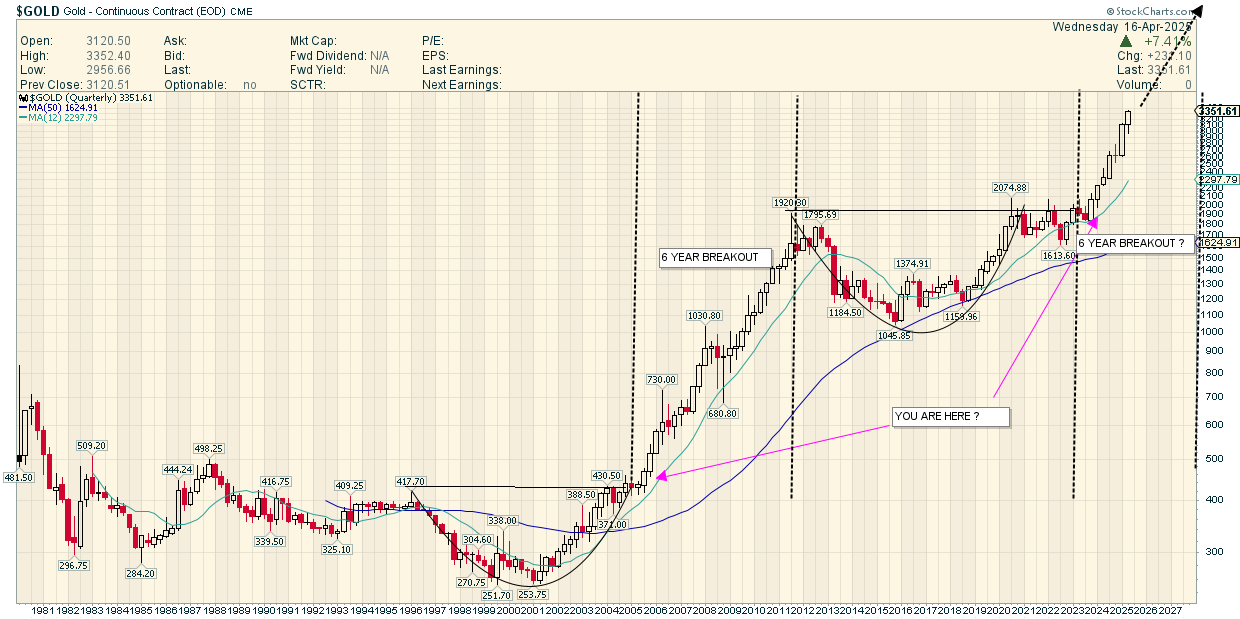
HERES A REAL LONG TERM GOLD CHART
I just found this one I drew at the breakout point…honest…see the “You Are Here” ARROWS !
It’s a Log Chart …See the Implication ???
Anyone care to quote the Price Objective circa 2030 ?
@ Farmer …You indicated you see a Top due to a 10 year cycle
I see a 10 year cycle..The first Bull was from 2001 to 2011 ( 10 Years )
This Bull started in 2020 and should go thru 2030 ( 10 Years )
Also A 6 YEAR BREAKOUT FRACTAL…and we look to be about 1.5 years along the way
What am I missing ?
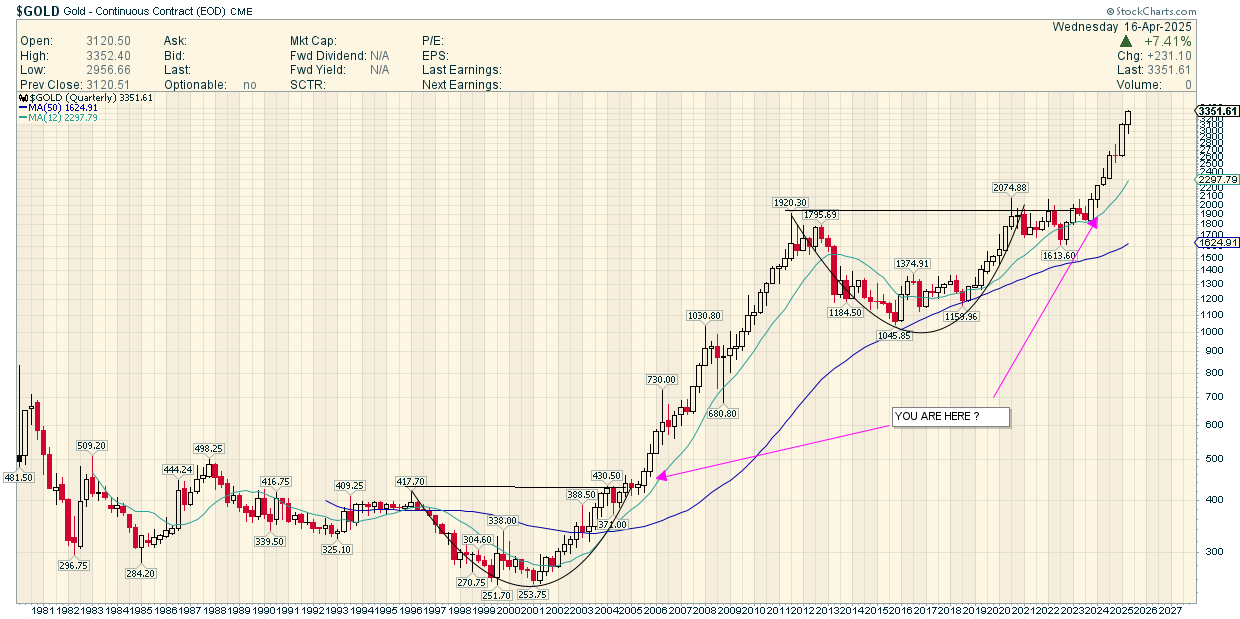
UPDATED CHART