Update on “to B”
To para-quote a charting Luminary
“It sure does feel like a big drop is underway.”
In EW, Ws Xs and Ys are sometimes used to represent higher degree ABCs, eg W = abc internally.
So the B wave high I’ve been watching is marked by circle X here.
Is it finally done?
Most have been watching this current drop as the (implied, unmarked) iv th wave inside the final white 5th wave.
(Implying that a final implied v th wave rally remains.)
UPDATE: Here is a graphic showing that possibility, using the dow
https://pbs.twimg.com/media/F3tiOYsaYAAINvs?format=png&name=large
Maybe that is not “to B”.
NB: the chart covers lots of time and price, so its very easy to overlook circle Y.
DON’T.
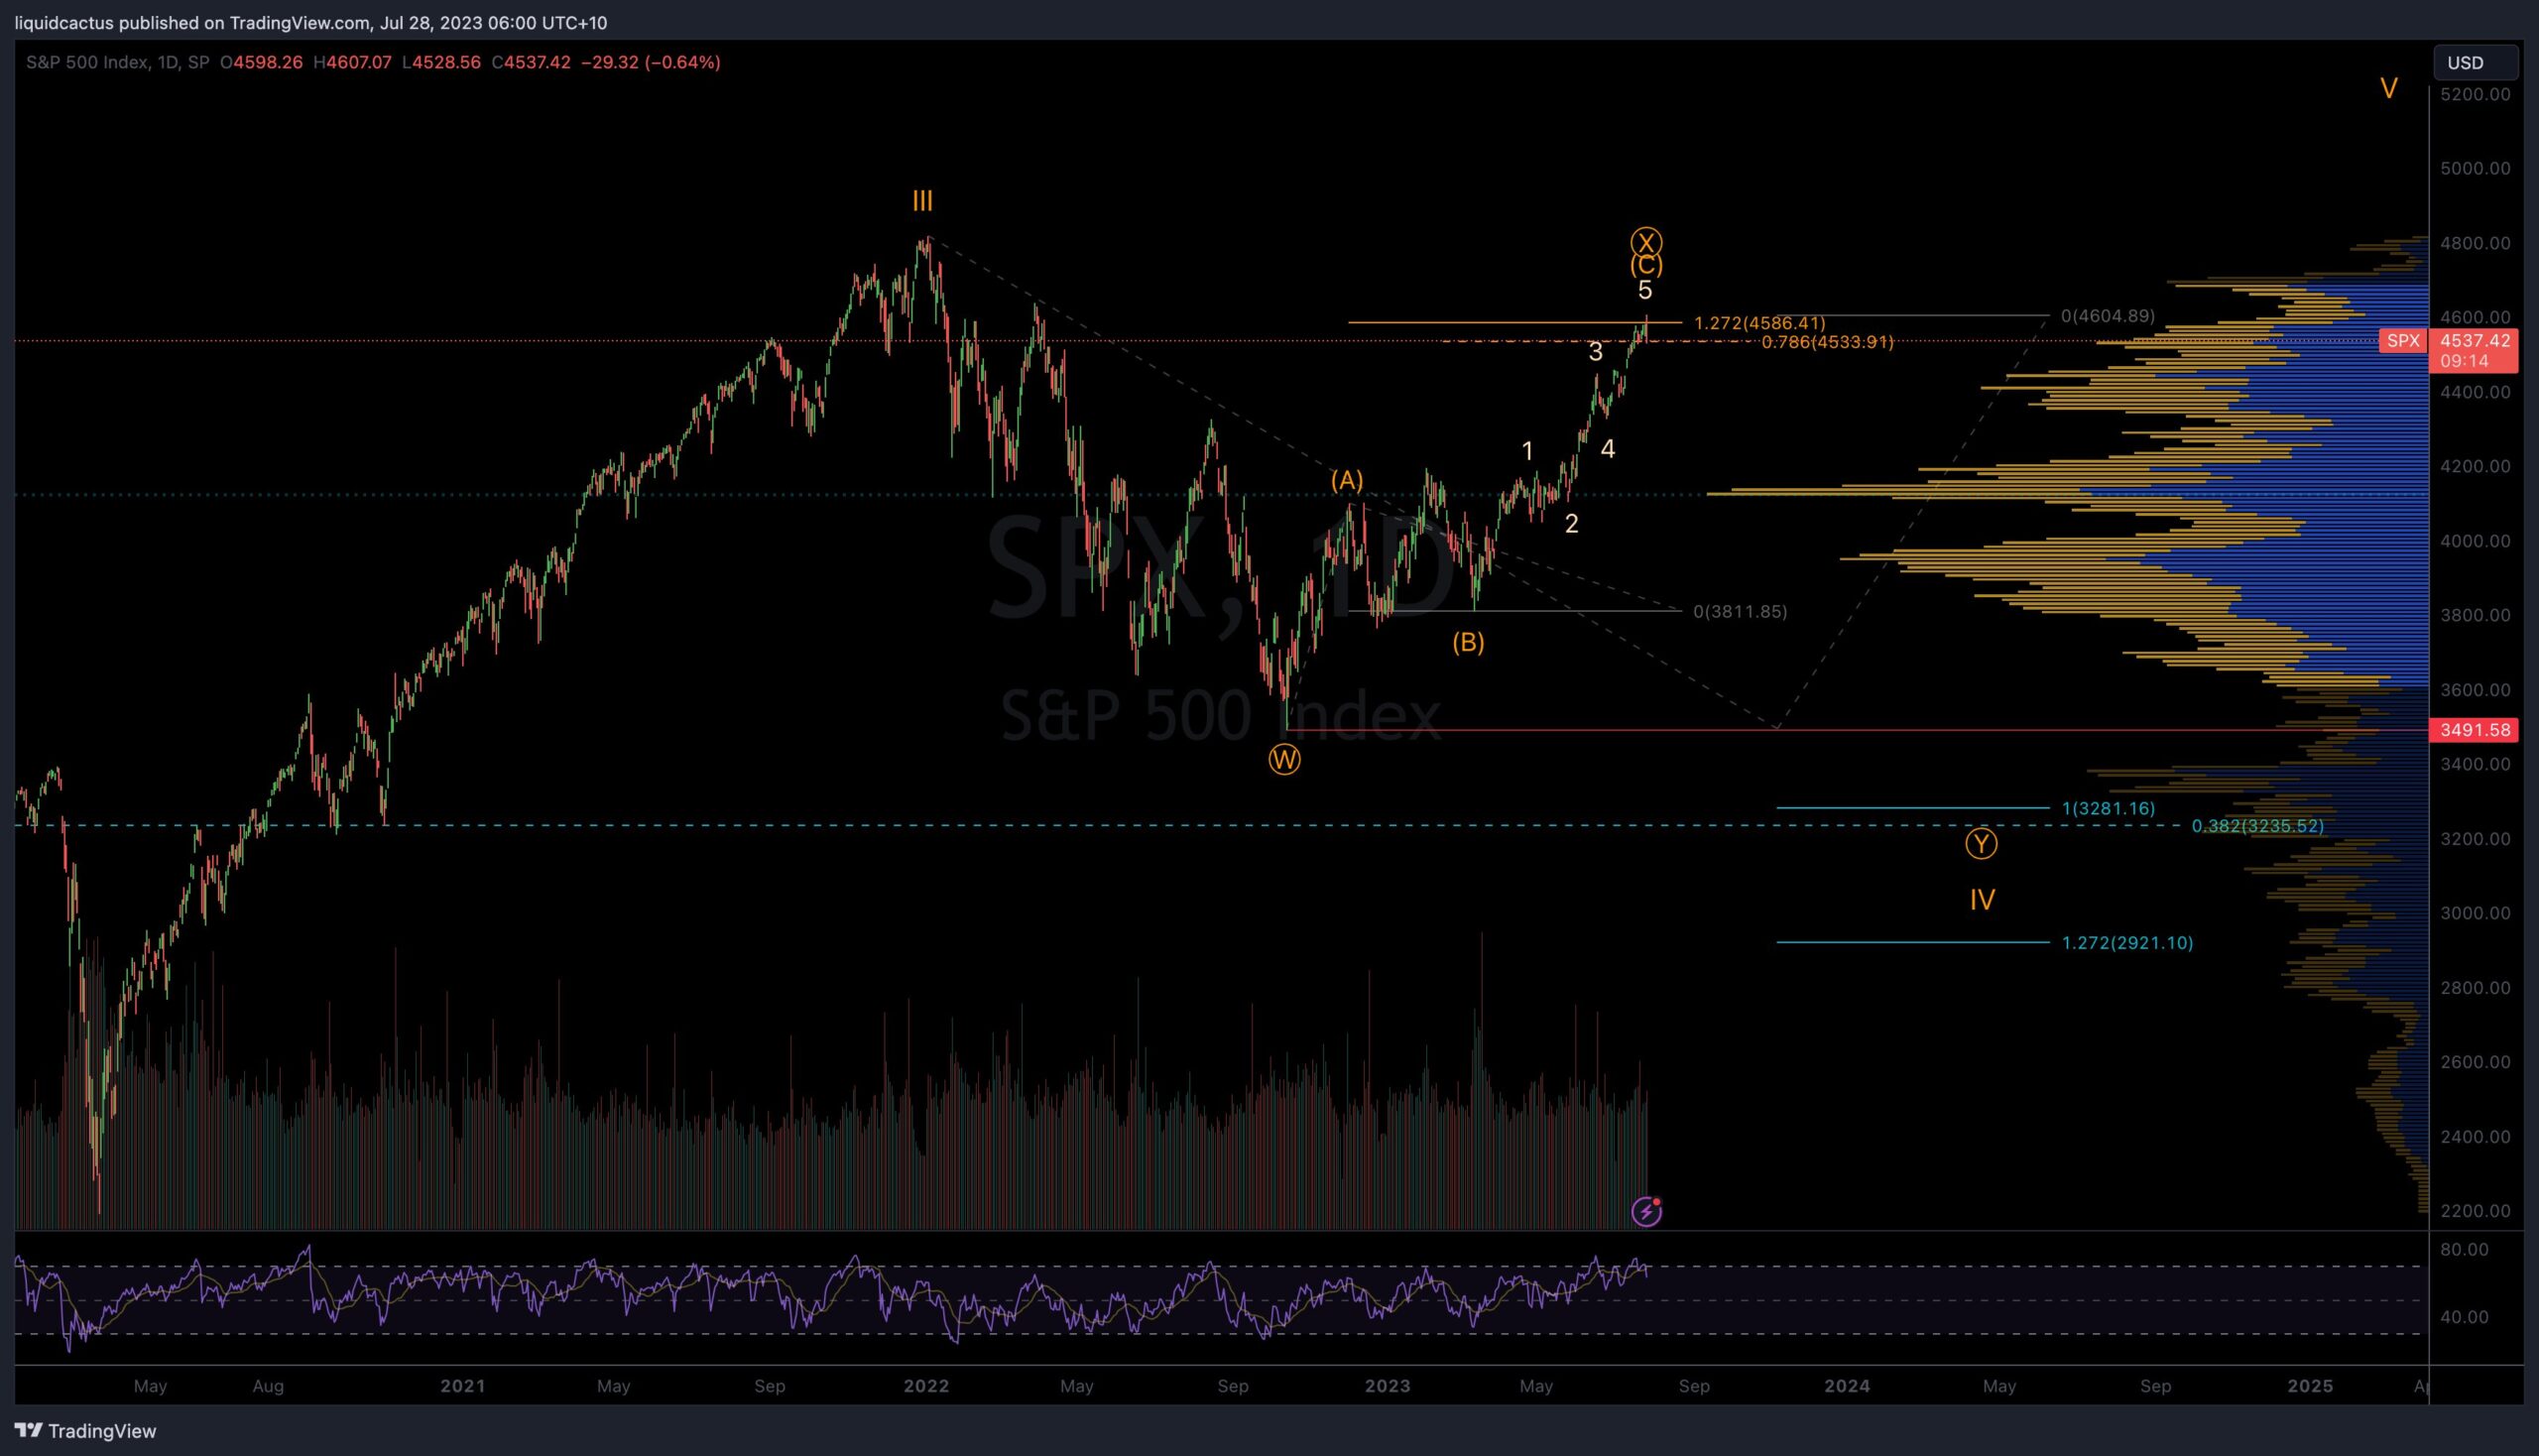
chart by liquid cactus
hi pedro,
can you possibly explain in simpler terms..??
for us more ignorant peasants…
many thanks,
kestrel
I don’t mean to be a hard ass, but these posts are only for those who have first spent at least 5-10 minutes studying the basics of Elliott. There is no simple way to explain everything implied here by a complex T/A framework.
THEN, if you have specific questions, I’m happy to address them. Elliott is challenging to apply, but relatively easy to read once you’ve done some homework first. That’s the prerequisite here.