Outlook for Silver Juniors Sours
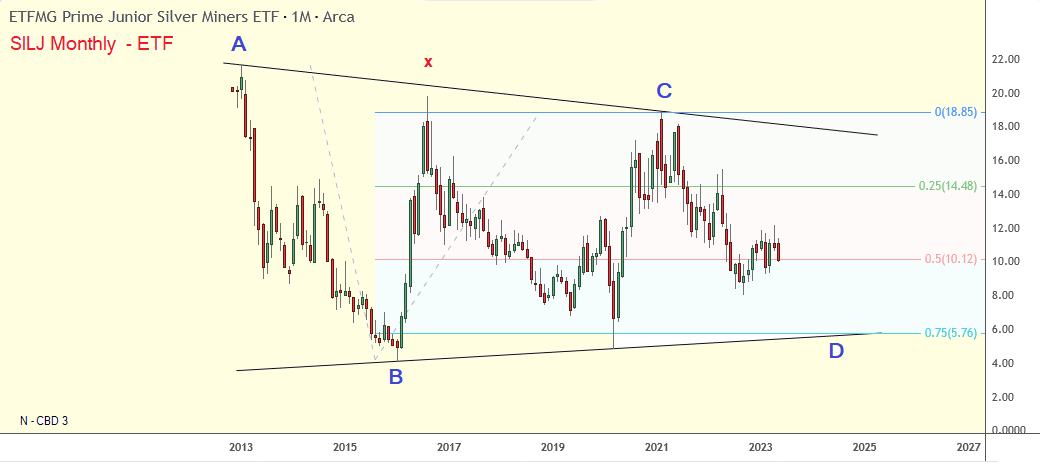
This monthly chart of Silver Junior Miners supports Nightingales recent post on SILJ suggesting a decline in miners of 50% from where price currently sits. More work is needed before a final conclusion can be drawn. But just a cursory examination of the chart backlit with Gartley extensions shows the downside target to be 5.76 which is a virtual bullseye hit on the lower support line as you can see.
Charts do not always meet such targets fortunately and I have a suspicion this will be one of those times that price reverses before seeing this dismal bottom. But keep it in mind anyway and take action as appropriate as this is how much damage the math behind the chart is warning is on our way. At least in theory. More on that later when I take a closer look at the pattern and try to offer a more positive analysis.
Note on the extensions: My points marked A,B,C and D would appear to differ slightly from how these drawings are normally done. Specifically, I have ignored the peak marked x and instead substituted it with the secondary peak (marked as point C). There is a good reason for this. Point C shows a higher closing price and this invalidates the prior peak. That is why the high at x was ignored in the Gartley layout.
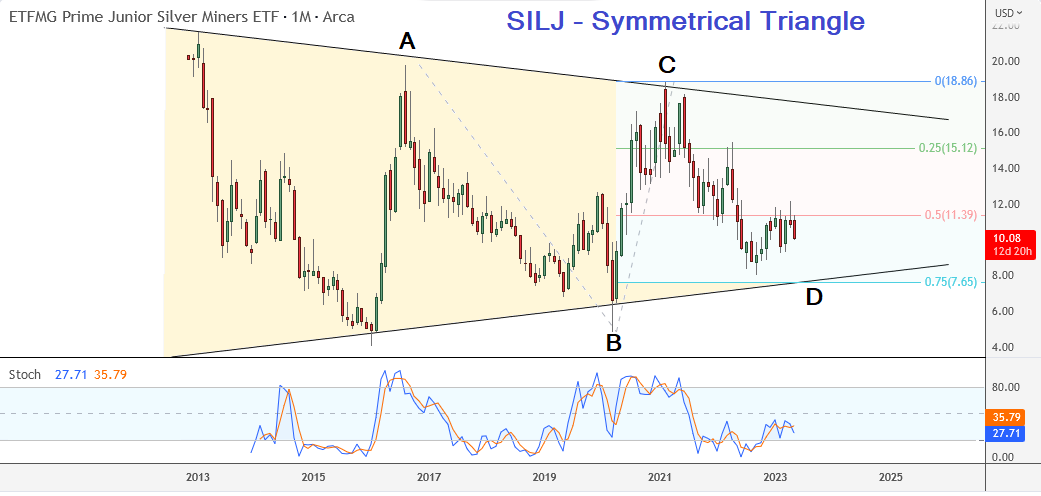
My preferred view is this second chart (below) where we can see SILJ in a narrowing Symmetrical Triangle. This chart still suggests a decline in price of 25% but its a better candidate for how reality will be playing out near term. One thing of importance to note however is that this is a narrowing wedge pattern and that by itself suggests a long wait before miners finally break out to the upside. This chart is already 10 years in the making. How much longer of a sideways struggle before they breech the upper resistance line and finally see their day in the sun?
Good to see commentary supported by charting analysis brought to bear on this sector.
Several months ago, I was bearish the PMs into late summer, when the regional bank issue abruptly turned it 180. I also thought the ensuing rally had several more weeks of life left, before the storm clouds would arrive. But they showed up early.
My system basically works like indicator ping pong from OB to OS, where the longer degrees take precedence. So, we should (still) have months to go before we hit OS at those higher degrees. Just as I had been expecting before the KRE crisis driven detour. But anyone looking at SILJ or SIL from last summer should have noted the relative weakness of the miners, as Fully was pointing out repeatedly. Given the economic backdrop, I suspect some kind of financial black swan may still be looming to spur the washout. Is the piper finally getting paid?
Yes pedro_deleon I completely agree. There has been a dearth of analysis in the metals market for quite some time now. I suspect it has had a lot to do with the dramatic social changes we are going through. Long time professional chartists and technical people are no longer posting and writing as they once did. For all we know many of them were disabled by the shots or have been so distracted by life’s other complications they went into retirement.
I have no idea what is really happening of course. We can only speculate. But when I went around to my old haunts in the gold and silver space I found precious few professional technical studies. We here at the Tent are therefore among some of the last giving this important area our attention. So lets give the public what they need since the fundamentalists are almost always in a blind panic about the dollars destruction, war and gloom and obviously have no real insight into chart structure or price mechanics of the assets they are promoting as salvation.
Of course those kind cannot be relied upon to give any trading advice or information other than the tired old lines about stacking before Armageddon arrives. I am sure I’m not the first to say this, but the technical picture does not agree with the doom and gloom that the fundamental crowd keeps promoting so heavily. Quite the contrary. When I look at the technicals I feel absolutely bullish about the future in general since rapid advances in the prices of precious metals are typcailly associated with calamity of one sort or another!
These charts are not shouting calamity. Under the hood, the ebb and flow of the metals market is about as calm as it ever was.
So you guys will be waiting for the miners to test the 2020 Covid lows. Is that the bottom line? That’s a long way down.
The Fibbonacci retrace of the price move between the Covid lows and the February 2021 highs has already almost achieved 78.6%. So my second chart is merely saying we will retest that line before relaunching. I did not show the Fibbos on my chart since it gets so messy tryng to mix too many methods together. The Gartleys show a bottom at 7.65 whereas the Fibbos suggest 7.88 as a bottom. Both numbers are pretty close to one another increasing the probablility the call is valid.
In other words….we have already been that low once already! So no waiting is required for even more dismal prices. Its just a matter of time now before the reversal comes. We will see it in the form of a double bottom in the seven dollars and change range. On that note my post is poorly named. The post should have been titled as “Outlook for Silver Juniors Brightens (since we have hit the lows already)”!
Thanks. I see some guys are looking for a decent buying opportunity sometime in June.
Welcome traderfromhell and thanks for pointing it out. I just realized after seeing your post that I was slipping into a slightly more negative view of miners than was justified. Especially as most of the damage has already been done. So now we wait. Things should be looking up fairly soon. I am sticking with my Christmas timeframe based on my prior chart study of silver.