A Deeper Dive into Silver Futures
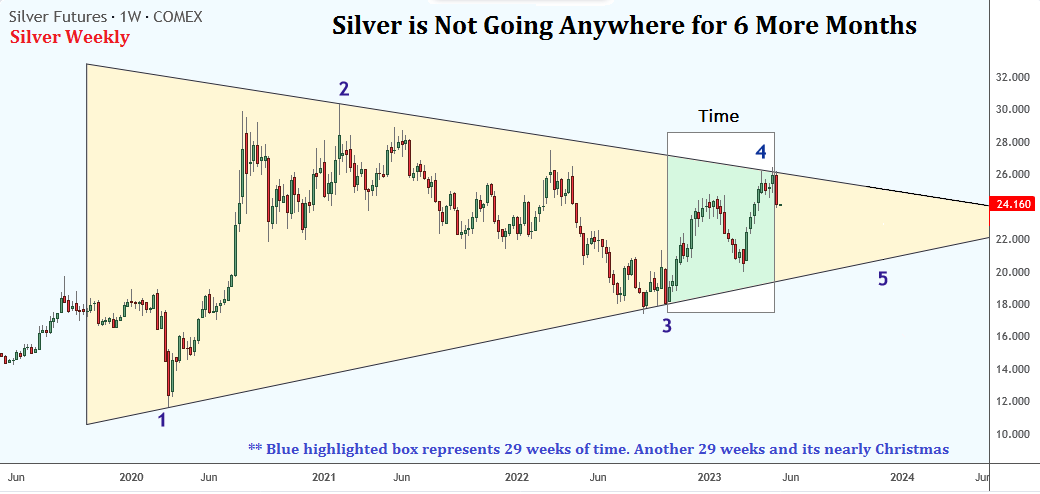
Yesterday I presented a short article on Silver and printed a nice chart pattern I have discovered which to my eyes is unequivocal in its clarity. The pattern is a classic symmetrical triangle. Today I want to discuss it in a little more detail for the benefit of new traders who may be struggling with time frames. So the weekly chart attached will focus on the triangle itself which I have marked out where price touches on the support and resistance levels.
And I have a green boxed region which represents a period of 29 candles (which is 29 weeks).
Let me offer my apologies in advance to the megabulls here who may be feeling that my charting is throwing a lot of cold water on their to-da-moon bull thesis for silver. Silver has a bright future alright. No denying that. But like everything else in this world it will not happen until time itself has exacted its price. We often get so focused on price and the excitement of sharp moves that the element of time is all but forgotten.
I do it myself constantly and have to refer back to older charts I drew to remind myself to slow down and just let the magic of the days ticking by play their role. We will surely get to where we are going. But it can’t happen without the journey taking place first.
The key takeaway from this chart is that it shows the price pattern is now firmly bounded within the confines of a support and resistance channel that is narrrowing towards an inevitable distant vertex. We can now know with a fair degree of confidence where price will next hit bottom and from where it will inevitably bounce. So what remains is estimating how long it will take to happen. This is the cold water part of the days analysis since the most recent price spike was actually a long drawn out 29 week affair!
Shocking. It felt like a month as it was taking place.
Just spacing the points 3, 4 and 5 equidistant from each other on my chart and we may anticipate another 29 weeks will be needed for price to retrace back to the support line. It is a very long time. That takes us out to the start of December 2023 and the approximate loss in price for silver futures between here and there could range from 3.50 to 4.00 dollars or more than 15%.
What I am really saying however is that there won’t be a bull market in silver breaking out during the balance of this year if price simply follows the program inherent in every triangle pattern. Odds currently favour a decline in silvers price and with our chart in hand we know with some confidence where price is going next. So that gives us a little more than 6 months to plan and be prepared to buy what looks likely to be the last bottom in silver before price breaks out into the bull market zone.
If I am correct about any of this then we are also entering the accumulation period for mining stock so take note.
Miners will start to telegraph silvers new move ahead of time and some will start rising even as silver prices soften during this downturn. So the focus now should be on stock selection with less emphasis on the metal itself. If anyone is interested I can do a little forecasting on the silver stock of your choice. Just mention in the comments and I will take a look.
By the way, gold will also appear to be in the Doldrums until at least December. There is no real liklihood of a big price breakout there even as silver is pulling back to our support line. So this is good news in fact. Both metals look like they will consolidate sideways a little longer. For us traders we can take a deep breathe and just count off the days and wait patiently. Metals will not be getting away on us anytime soon. So enjoy your summer people. The real action does not get underway until its almost Christmas time.
Simple Clear Picture
Patience is a Virtue
Pure Chartology
Thanks Farmer
Do you put any credence to the theory that Price usually breaks out one way or the other BEFORE the Apex ?
Indeed. Its expected. Once price reaches the support line there may be a few hours when it throws a price spike lower and a fair distance below the line. On a daily chart it will look like a tail wick after the fact. But if we are not careful we could sell into the drop thinking a breakdown had taken place. It happens all the time.
What is really taking place though is the big buyers are greedy and want as big a bang for the buck as possible. So they will set up their buys in advance well below the line then crash price so they all get picked up before launch. Then price soars and takes their contracts skyward. In the process they also knock everyone else out of their positions and stops and leave them empty handed in the dust. So Wall Street is clever and greedy. LOL
Glad to hear the charts are useful Fully. Thanks Brother.
Where have all our silver traders gone? We used to have a huge crowd who were serious stackers. Has this Covid nonsense finally taken its toll so that nobody wants to talk about metals anymore? Tell the truth, I have returned to charting since the New World Order is really starting to depress me. I need charts just to get my mind off all their bullshit.
A false breakdown is what we want to see, below the lower rail, and below 3, to take out all the long stops.
On higher volume…capitulation selling.
The herd will be talking $10 silver then.
Excellent analysis Sir Farmer. The good news is that if this is the way it plays out stackers will have more time than I anticipated to keep buying physical silver. I am still not convinced the Comex fraud will make it all the way to year end, but hope your timing is correct. I agree that the miners will act in their usually expected long term role(which they haven’t always done in this cycle) by starting to outperform even while the metals drift within the triangle. I don’t agree with Sir Spock that a break below 3 is coming. That would invalidate the triangle and throw everything out the window. You don’t usually see a repeat or similar action in the same cycle. You got that once in a cycle behavior at the 2020 Covid shakeout. As much as that would be a great buying opportunity it is unlikely to manifest in the same way.
A question and possible alternative. When and where one chooses to start the top line of the triangle determines one’s perspective. If you take the actual high after the 2020 low which is the Feb. 2021 high and connect it to the two subsequent highs in May 2021 and March of 2022 then the recent rally already broke the downtrend line.That would mean this is the subsequent backtest and a new high would mean the correction is over. It will be interesting to see how it plays out.
could you do forecasting on WPM Wheaton Precious Metals Corp.
thanks
No problem Peter. WPM is a great choice for an assessment of the miner market. Will do tonight.
also, I have a question: does this have take its time? or can it resolve sooner then december?
I can only tell you my experience with triangles Peter and its that price tends to keep bouncing around between the upper and lower lines longer than I would usually guess. The boundaries tend to hold price confined until late in the pattern while keeping suspense high. I am sure its to make us all crazy! LOL
I’m also going with WPM as my top pick for the coming bull…
I will try to get on WPM tonight Hermit. I took a quick look yesterday but no drawing yet. My assessment was its a sell in line with what silver has already told us. But how deep might be a bit discouraging for you. Personally I would hold off on plans to buy it until the smoke clears on the current silver decline. Just looking at it now btw and WPM is down 3% today.
Totally gonna pick up some SILV, HL, and GLGDF along the way though… how about DSVSF…