DRV
DRV is an ETF instrument (derivative) that trades 3x inverse the direction of Real Estate (RE). If RE crashes in earnest, this instrument makes good return.
For Marcusjames and ALL.
DRV-LT
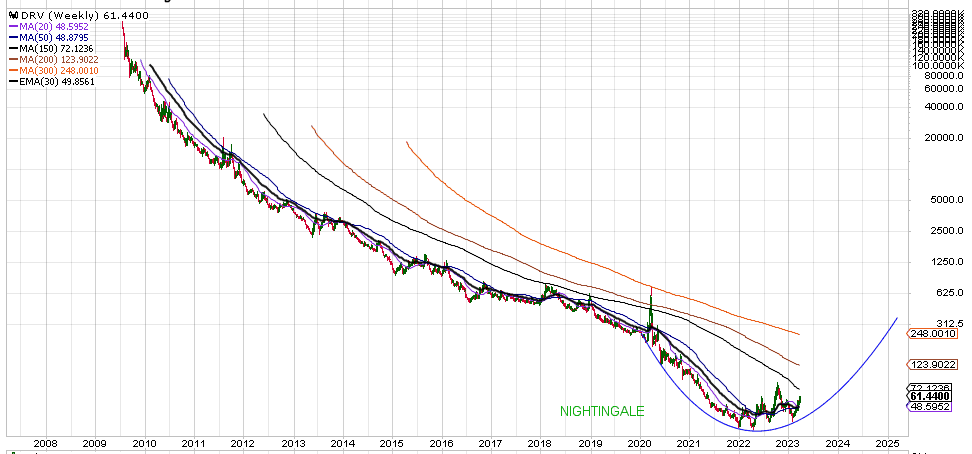
Setting DRV back the beginning of its existence we see a declining ETF which makes sense in two ways: #1 DRV is as from 2009 and thus after the 2008-crash and assets like RE only climbed higher. #2 it is 3xETF and therefore price ‘compounds’ making in this case the decline exponential.
The only thing that make charting this DRV-LT are the years as from last spike; the year 2020. Whether the parabolic is set correct or not, it gives us a Cup & Handle (C&H) and is something to at least keep an eye on. This also inform us that the DRV-trade is sort of a LONG TRADE as the ‘CUP’ goes into beginning-2025 or end-2024 before potential BO-UP which by then could be explosive as this instrument ‘compounds daily’. CUP shows HOR.RES @ 300 approx.
When zooming-in … we are able to work the chart. Still, the CUP seems a good fit of the parabola. If indeed a C&H then I give 3 options: #1 CUP @ 248, #2 CUP @ 300 and potentially CUP @ 707. The compounding targets can be seen within the chart. Again, the (insane) multiples are because of the compounding effect.
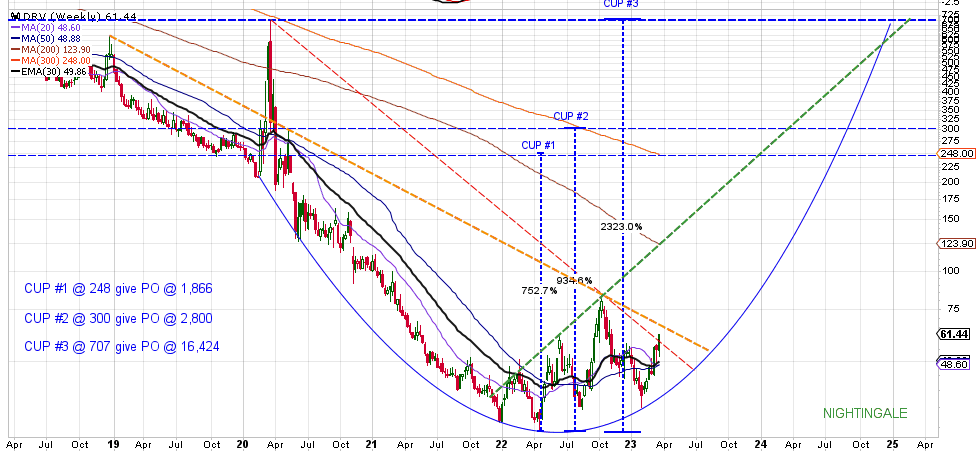
Observe three DASHED lines; RED – ORANGE – GREEN.
DRV recently BO-UP the RED dashed line. Possibly this week (incl. last two days) DRV could even have done its BT and UP from here she goes. But as the RED dashed line is take from 2020-high let us be a bit more conservative. Observe the ORANGE Dashed line and not taking the 2020-spike into account which is fair as DRV rejected the 2020-spike and therefore should potentially be dismissed for charting (!) If ORANGE dashed line is valid then expect RES @ 66 approx.
I guess, the GREEN upsloping line will function as RES for any possible UP-SPIKE which could happen ‘suddenly’ once/if INDU crashes in earnest but expect W-MA @ 123 tagging the GREEN line as intermediate RES which is 100% UP from here.
Interesting about the GREEN dashed line is; it meets the END of the CUP end-2024 – possibly beginning-2025. This confirm many of many other charts as that period of TIME marks (other) turns including currencies like USD and EUR but that aside. We could see a Handle being formed after 2024. Therefore CUP #3 has potential but better count on Cup#1 or CUP #2. We can evaluate in due TIME.
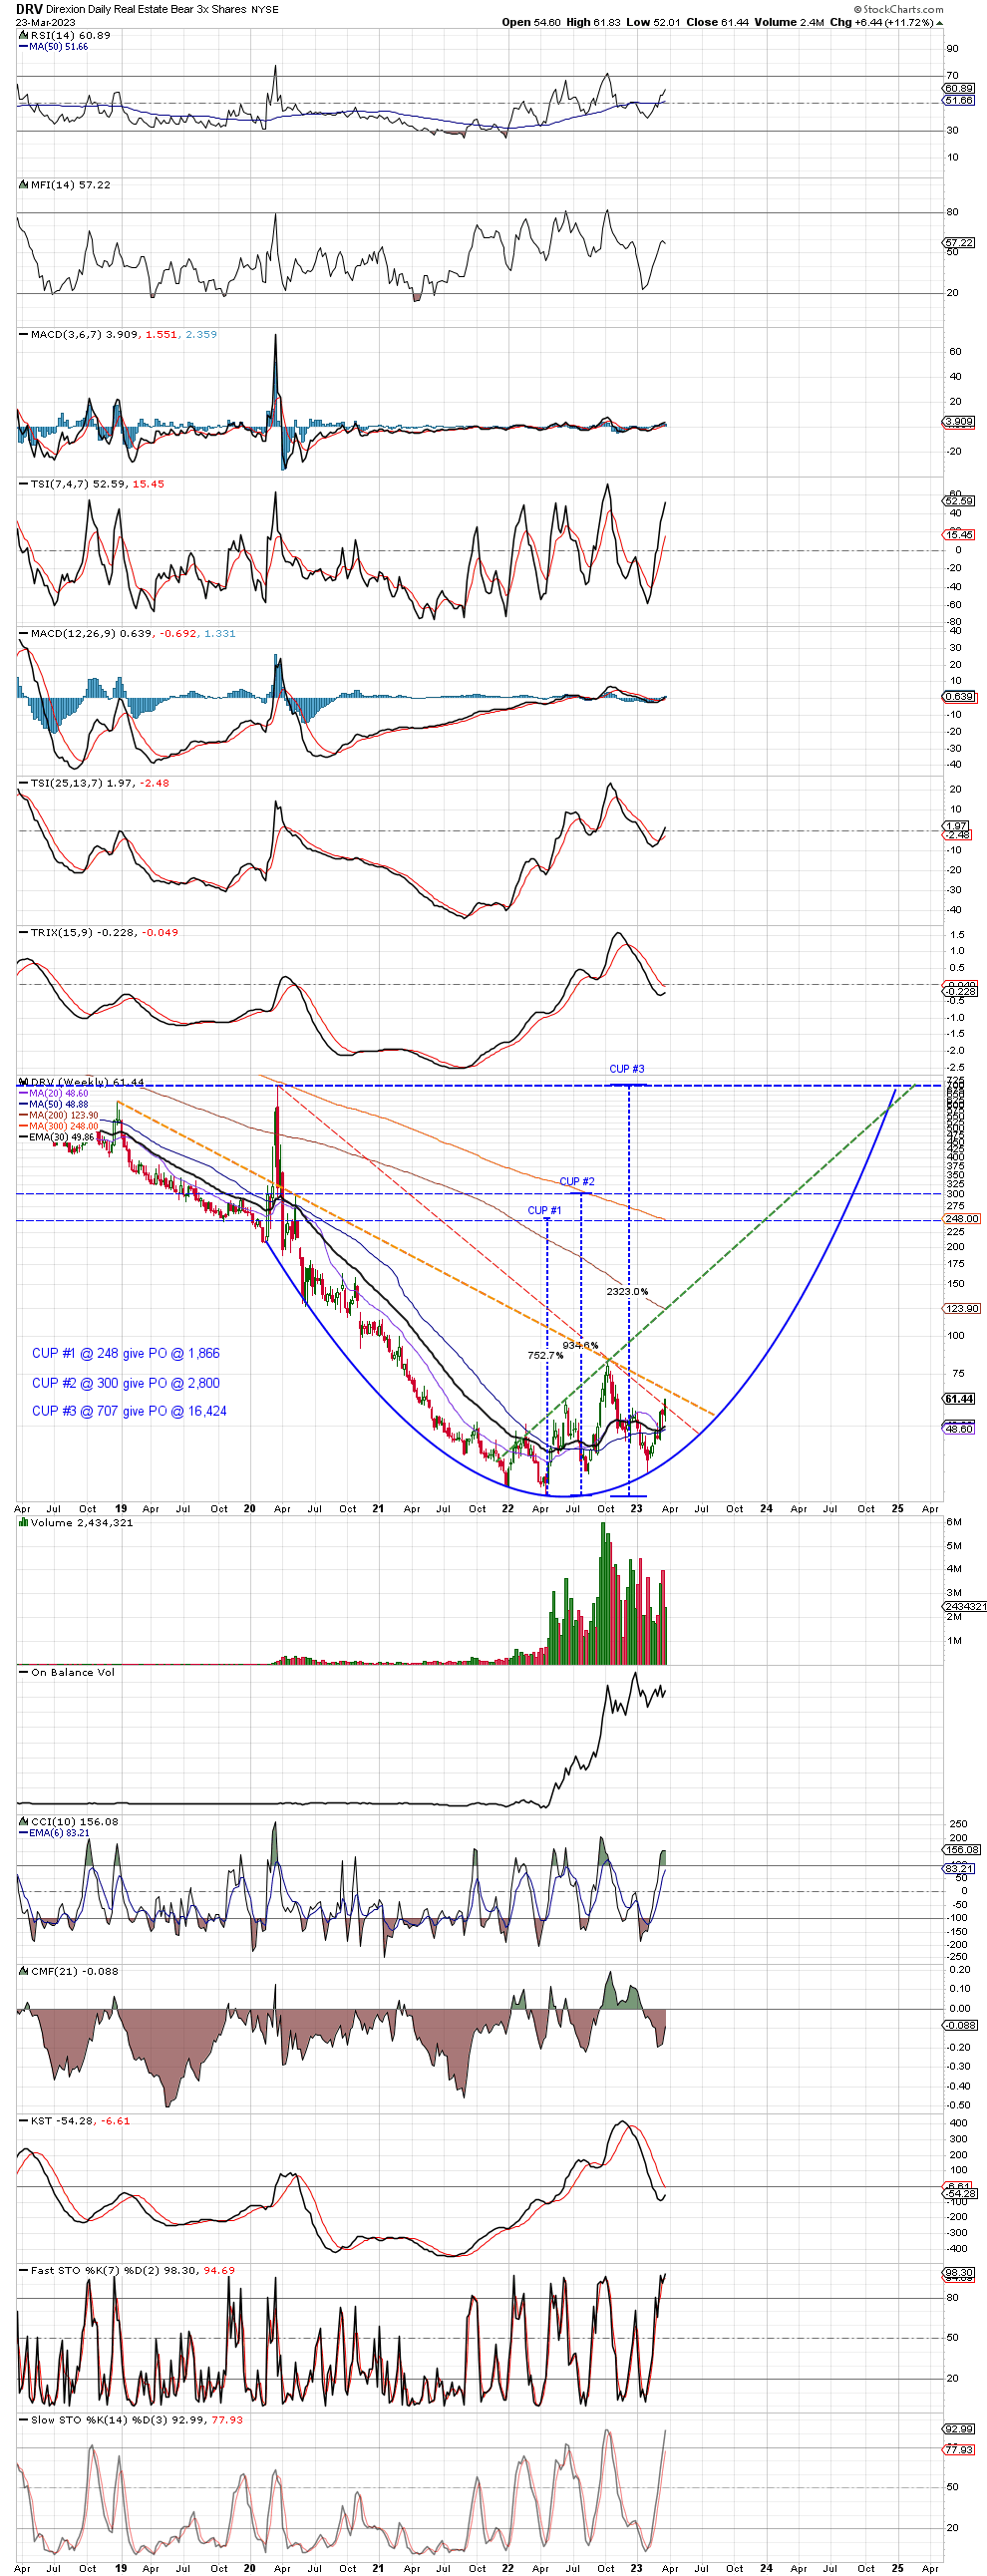
Indicators looking good as RSI give plenty of room to the upside. But some other indicators are getting overbought (FAST/SLOW-STO & CCI). Behold VOLUME which is incredible compared to former years and gives reason to believe that DRV-trade is FOR REAL. The FOUR HORSEMAN all crossed Positive where we await the TRIX crossover for confirmation to GO above ZERO-line. Taking indicators and chart in perspective; we could higher price going forward and a pull-back (or BT) is to be expected. Line in the sand @ 50.
When we expand TIME we can add some value to the chart. Please dismiss the mismatch of the CUP-parabola (for settings I have not altered). I remain with former chart as correct.
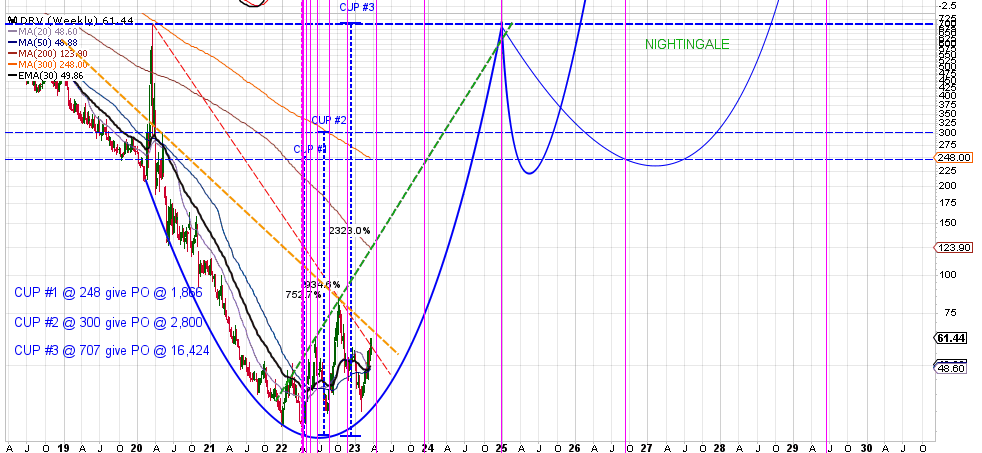
Setting CYCLES in this DRV-chart makes no sense so I added Vertical FIB TIME zone marking DRV low as starting point. First incoming Verti.FIB is at 10th of April and such is ARMSTRONG turn date. No, I am NOT matching his dates … it is only remarkable. This in itself gives plausible reason to believe the VERT.FIBs are set correct (!) Going forward in TIME … end-2024/ begin-2025 is the following VERT.FIB.
I set two BLUE handles of the CUP for which I would count on the THICK BLUE HANDLE. Which could go as high into the following VERT.FIB around Sept-2026. Reason is my personal reasoning when I consider the LT- EURO chart where the EU/EURO dissolves during 2027.
EURO see: https://goldtadise.com/?p=557214
USD see: https://goldtadise.com/?p=557134
Personally, I do not even think TRADERS account will exist into 2029. They all might have been confiscated. At best DRV-trade is LONG TRADE but not longer then September-2026 as after that Collective West seize to exist and with that possibly Stock Markets as well.
On the Short term:
If DRV should pull back eg. a BT consider W-EMA(30) @ 50 as possible good (reliable) entry which also marks HOR-SUP. But consider 61 also as a HOR-RES. Possibly await either #1 a pull back and start scaling into the trade or await a BO-UP above 61 and enter the trade not more then 50% of allocated trade-sum and reserve the remaining 50% for any pull-back, In this way you control your stress levels which is important to be able to make it to the finish line of this LONG TRADE. GL.
IMO.DYODD.
ADDED: changed 2x ETF into 3xETF.
It is a triple inverse, not a double inverse ETF.
indeed a triple.
Got in at $49. You said $50. Close enough. Thanks for keeping my head cool and to consider waiting for around $50 to get in. Hard to imagine it crashing more, but we’ll see. Using a small bit to start as I scale in more toward and if it breaks out above $61.
Wow!! Thanks. You went far beyond expectations to provide TA. I am grateful.
Technical analysis doesn’t work with leveraged ETFs IMO.
Could you tell me why? I have some ideas as to why, but I’m curious what are your reasons.