Gold technicals … not for faint hearted (and mostly all EW to boot)
RBC year long tri
https://pbs.twimg.com/media/FI8PCHJUYAIC_aB?format=jpg&name=large
Bullish outcome if tri ends a correction
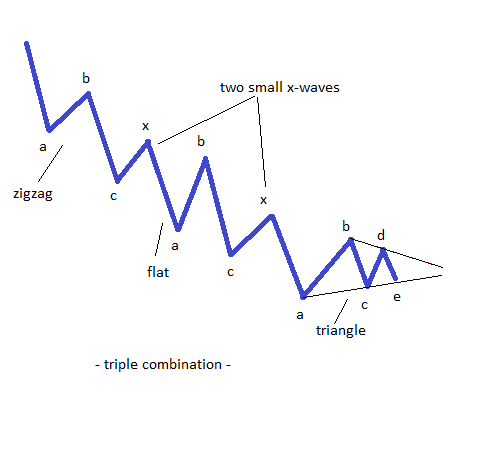
https://www.topratedforexbrokers.com/images/complex-corrections6.png
But sorry, my monthly gold chart CLEARLY advocates for a top soon (money flows OB in 90 zone)
so that means the complex corrective schematic is off the table, and RBC’s triangle is off one phase ….
his circle a becomes end of zig zag A down,
his b leg up then becomes the first a leg of triangle B, still needing e up (not e down),
and a bear C of large degree follows
perhaps to resolve THIS problem
https://t.co/jGa0EAyZbl (h/t Collum)
Here’s my friend Sam’s take on this idea, where he has the move down from the highs as a WXY, not my ABC, but with a similar result.
https://t.co/tFqYzNPNXb
He has the WXY, where Y is just a zig zag, not an impulse.
Either way, as C or Y, it means the move down from B will be a large three wave decline at higher degree.
THAT WOULD BE NECESSARY if the entire CORRECTION from 2011 plays out as a IVth wave triangle.
Note Sam has “D” up down the road. That’s indicative of a triangle outlook, which he has starting from 2011.
And where A of the triangle at 1045 was the price low in ’15.
Every leg of a triangle must be a three wave move, as zig zags.
All of which underscores my comments over recent months that the correction has YEARS TO GO, but it will be mostly a sideways affair. Y of C down, D up, then E down, before a Cycle degree Vth wave rally commences.
But of course, this is all just EW garbage right? Well my 2015 post outlined the bigger picture, but QE changed the expected IVth wave zig zag and the 750 target, and gave us a triangle instead. And I did allude to that possibility, noting zig zags were most common but other possibilities existed.
So we’ll have to TRADE this for a while longer.
“… the correction has YEARS TO GO, but it will be mostly a sideways affair.”
It sure looks that way.