What’s Next
So while the bears were taking a victory lap late last week, the gold chart suggests two possible bullish scenarios. The more conventional would be a one to two week buildout of a right shoulder in the obvious inverted H&S pattern. The less obvious scenario is a more unexpected massive reversal that breaks back up to and thru 1840 and beyond. If that were to occur it would probably be as a result of the FED becoming even more doveish about taper so we won’t know until after their Wednesday comments and the market reaction. 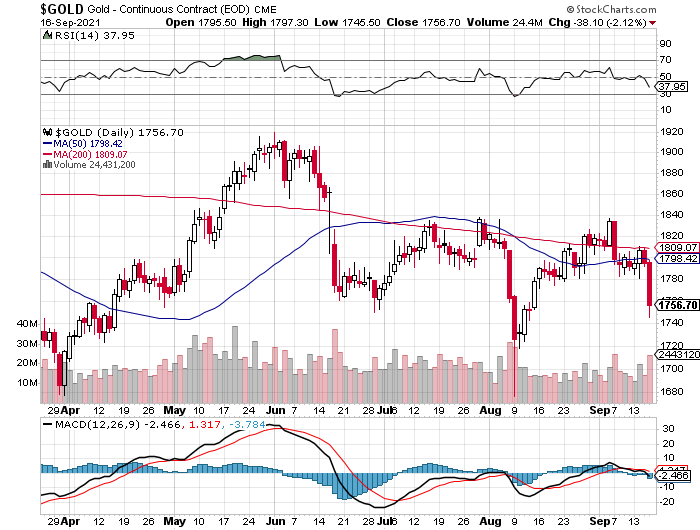
The chart is from Thurs. close because I have been having trouble with Stockcharts. Don’t know if it is them or my computer? The inverse H&S completed on Friday and the first scenario I mentioned would lead to a six or seven day right shoulder buildout similiar to the left shoulder in late June. In the second scenario, if the reaction to FED comments leads to a breakout above 1840, the pattern and year long correction would be over.
Not sure if I have been thrown into this basket of deplorables called “the bears” b/c I don’t consider myself a gold stock bear, rather an objective analyst who recognizes that the gold stocks have been in a bearish configuration since August 2020 AKA bear market. But I recognize the PM stocks are in a secular bull market, but presently in a cyclical bear within that secular bull. I certainly have not taken any “victory laps” as I refuse to short the gold stocks recognizing the explosive upside potential they retain (esp the silver stocks).
Regarding the PM stocks however they are always subject to counter trend upside spikes (they certainly are now) however my work maintains that the primary trend remains down for now.
Now if one is entitled to any “victory laps” I will take one in regards to my sized short position in CAT. It came through today. Come on over to the Rambus site where I have listed several more like this and why:
https://stockcharts.com/h-sc/ui?s=CAT&p=D&yr=0&mn=8&dy=0&id=p92385721629&listNum=239&a=1029469547
If the shoe fits wear it. I didn’t use the phrase deplorables and I didn’t mention any names. The three or four bears who had snarky comments and or took victory laps know who they are(that includes some comments from yourself). You have been very clearly bearish for months(and correct about immediate direction). I have a problem with anyone,(whether yourself or EW, cycle people etc. who use secular and cycle bull and bear markets to describe their calls, it is too open ended. You have gotten the call right and that’s what is important. The labels just give cover to others who want to be able to claim after the fact that even though a particular move was correct or more likely incorrect, that they said it was cyclical within a secular. It is just like economists on the one hand etc. Forget the labels. Look at the charts make the calls and live with them. Not directed at you but since you responded, I am tired with those trying to cover all bases in every post or call. I don’t do it(and yes I get some wrong) but I see a chart pattern, look at the technicals and make a call. Who cares whether the stock or asset is in a cyclical or secular trend? I usually address that by saying whether a call is a long term investment, intermediate trade or very short term speculation. Again, not saying you do that but you brought up the secular, cycle terms.
I certainly am a proponent of Robert Rhea’s teachings. He emphasizes that the #1 rule of investing is to invest along side the primary trend. I know of no better analyst than him (1920’s-30’s). In today’s world Mark Minervini states he never trades a stock against the primary trend. He is the best there is IMO. He also says everyone has their own method, but I will stick with his.
Regarding the utility of identifying whether a market is in a bull or a bear market, this is my most useful way to model a market and to determine the primary trend. It also gives meaning to the stage of psychology of the average investor. Frankly this, more than technicals, has kept me out of trouble over the past 6 months. Hopefully it will assist me in identifying a tradeable bottom when it comes.
Familiar more with Rhea, less so Minervini. I presume when you say you want to invest along side the primary trend you are talking more a matter of degree of percent of assets allocated etc. By trend you are referring to market trend? Not taking a stock say and determining it’s trend. Because we both seem to agree while it is easier to find stocks going up in a bull market and stocks going down in a bear market, there are still plenty of each that go opposite the trend and the charts, technicals and even in some cases fundamentals will help you identify them. Just as you pointed out about CAT. While we still at least appear to be in a bullish stock market(or at least at the time you identified your short) you found a good example of a counter trend(or maybe an early representative of a new trend?) So although I agree it is easier to go with the trend the chart of the specific stock or commodity etc. is really what is important.
Right trend equals trend of the sector not individual stock. And yes there always are some stocks that go counter trend. Example I rode GoGold hard up until late June (against the market trend) and it was a wise decision, but one has to know he is playing with the devil sort of speak.
Regarding CAT and the stock market, I actually think the general stock market has peaked and is now likely entering into a bear market. Obviously not confirmed, but will be in time
Agree about a general stock bear market, as I have said in a number of recent posts.
“in a cyclical bear within that secular bull.”
I’m in that camp, have said so in these terms, I know what I mean by that and I think most others can figure it out, and I can’t put it any more precisely.
“Who cares whether the stock or asset is in a cyclical or secular trend? I usually address that by saying whether a call is a long term investment, intermediate trade or very short term speculation.”
You can’t be serious.
As the best in the business have said, trade with the Primary Trend.
If you don’t even CARE, then you are risking trades counter to that trend.
And that’s what you have been doing all year, by and large.
You have stated that YOU are generally an IT and LT “trader”, but then flag short term reversals without elaborating on the timeframe for the trade. Make your outlook on these absolutely clear, and I’ll stand aside. My concern with your posts is that IMPLY certain trades SHOULD be taken (for the longer term I assume but can’t ever be sure), without clarifying the trade’s horizon or what you suggest be done if you are wrong.
You are clearly “clueless”. I am not a “trader”. That you can’t understand the difference to using charts and technicals to call turning points for purposes of entry and or exit points has nothing to do with the primary trend. Even in bull markets there are stocks that one can short(against your primary trend) and in bear markets there are always stocks that go up(maybe hard to find) that is what charts are for. You continue to want to put everyone into your box(definition on how one “should trade”). I don’t follow conventional wisdom. If that doesn’t work for you, ignore my posts. Don’t worry about others who can pick and choose from my posts whether they find any value in them. They can do that for themselves. When I make a call and someone asks me about the specific call(whether correct or wrong) I have always answered their specific question of my thoughts going forward on that specific asset or stock. Since you don’t trade on my posts(never have indicated that you did) then it doesn’t matter. Those that have, when they have questions have asked and I have answwered.