Pause & Be Ready – A PM Bull Market Overview
Well, it’s been a hell of a ride these last few years. Goldtent regulars will have seen my charting develop over the years. I’ve never claimed to be able to predict the future with 100% certainty. As a weather forecaster for over 30 years I’ve developed my craft and extended it into the world of financial forecasting. The techniques are very similar. Gather the evidence, apply suitable weighting and calculate ALL possible future outcomes, assigning probabilities to each outcome.
In the world of weather forecasting we have incredible supercomputers performing trillions of calculations per second, allowing us to view every scenario that the future may bring. In some circumstances, almost all of those scenarios are similar, allowing us to have high confidence in the forecast. On other occasions, when there is a lot of ‘chaos’ in the atmosphere, we may see many possible future outcomes, all with similar probabilities, which makes it hard to have any confidence, or forecast much more than a few hours ahead.
This brings me to my first point. I should say here, that what I’m attempting to do in this article is to try and pass on some of the things I’ve learned over the years, which will continue to help guide us through this turbulent phase of global finance/economics. OK, so point 1, If anyone here, or on Twitter, or anywhere else tries to say that this or that is definitely going to happen, and anyone with a differing view is an idiot, then you should give less credence to what they’re saying. Anybody who fails to accept that almost nothing about the future is 100% certain is incredibly naïve.
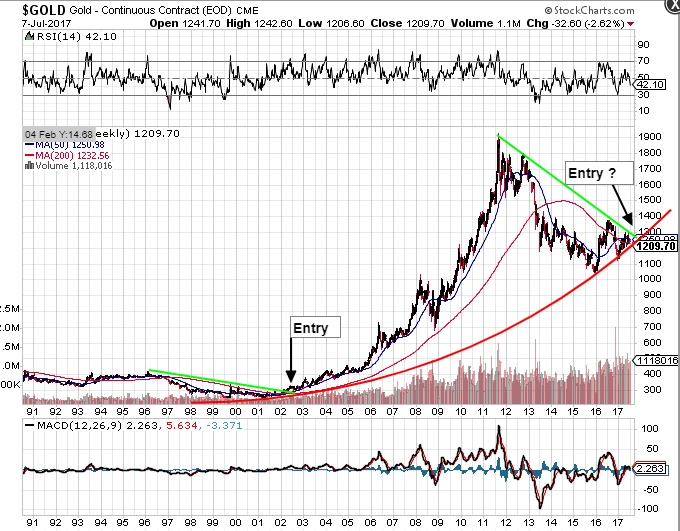
I became bullish on the PM sector as we reached the 16 year cycle low in early 2016, and posted this about 3 years ago in 2017…
More recently (about a year ago), I posted this (ignore the reference to ‘waves’, I’m no Elliot Wave expert. I was just experimenting)…
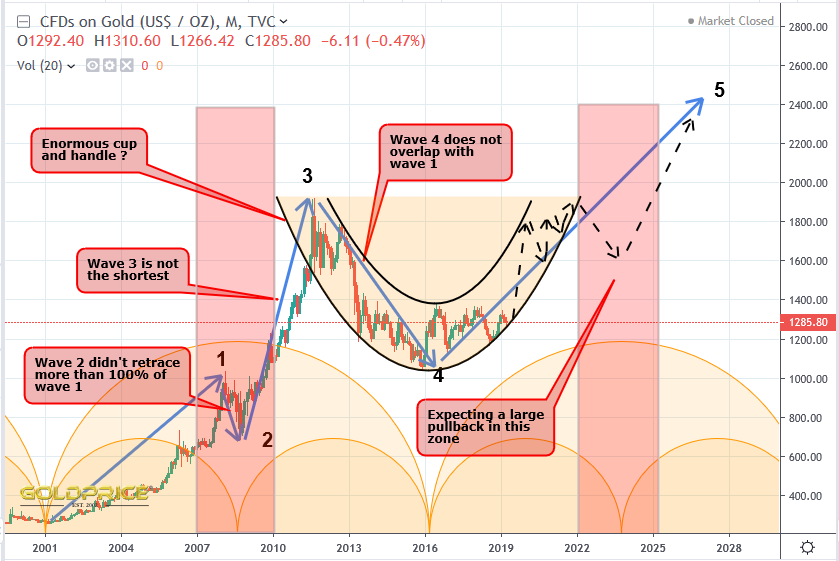
Both illustrate the power of charting (you may have seen me use that phrase in my posts yesterday). The charts can provide multiple pieces of evidence, with each ‘technique’ providing it’s own possible outcome or future scenario. This is just like forecasting the weather, except we’re having to do it manually. The second chart in particular, shows several pieces of evidence for the overall trend…#1 the 8 and 16 year cycles are providing ‘lift’ to the gold price #2 I’ve identified a rounded base or arc formation at this cyclical low, with price bouncing off the arc and confirming its relevance #3 price is trading in a defined (in this instance, curved) channel #4 I’ve identified the zone where there is likely to be pullback into the 8 year cycle low
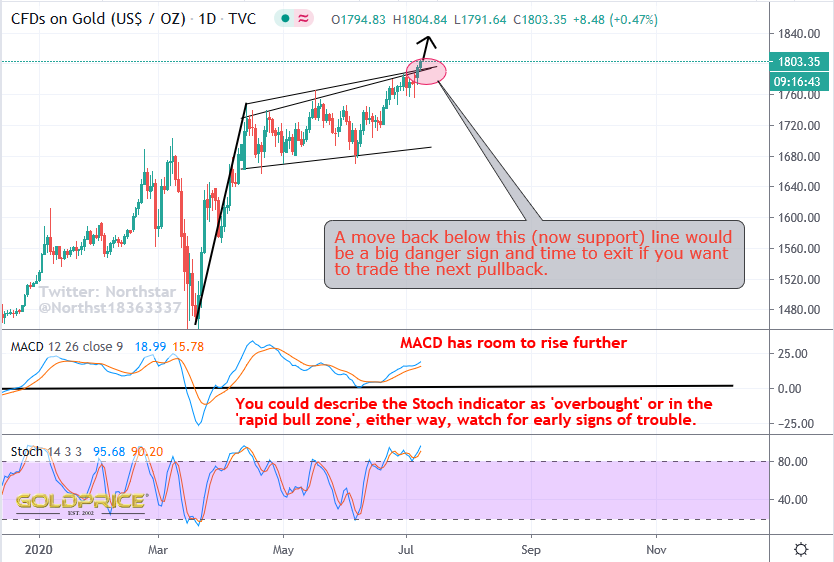
The charts have led us all the way from $1050 to $1800. I chose Northstar as a pseudonym because the charts are guiding us and lighting the way. This brings me to point #2 and the entire reason for this post – what next ?
As social media lights up with calls for ‘to da moon’ and everyone gets excited, we need to mentally prepare for a sizeable drop. It could play out over many months, forming a ‘handle’ on the cup which has formed since 2011. That is by no means a certainty though, and the pause/correction/pullback could be relatively short-lived. As always, the charts will let us know. I’ve been consistent in my calls that the odds were very, very strongly in favour of a return to $1800+ now that we’re here, we need to turn defensive, just as everyone else is turning bullish. If we fail to close this week with spot gold above $1800, my 30% probability of the correction occurring now will come into play, otherwise the probabilities favour a swift move to between $2000 and $2050. At the same time, the gold/silver ratio should drop a little, allowing silver (and the silver miners) to outperform (although I expect this to be more marked after the coming correction). The mining sector in general, has a lot of catching up to do. GDX is in the process of completing a ‘reverse symmetry’ move back to somewhere around $54 (currently around $38). At that point silver should be in the region of $21. So there you have it, $2000-$2050 gold, $21 Silver and $54 GDX. Lets just see if we can close the week above $1800 – there are probably some ‘evil’ forces who would like to try and prevent it.
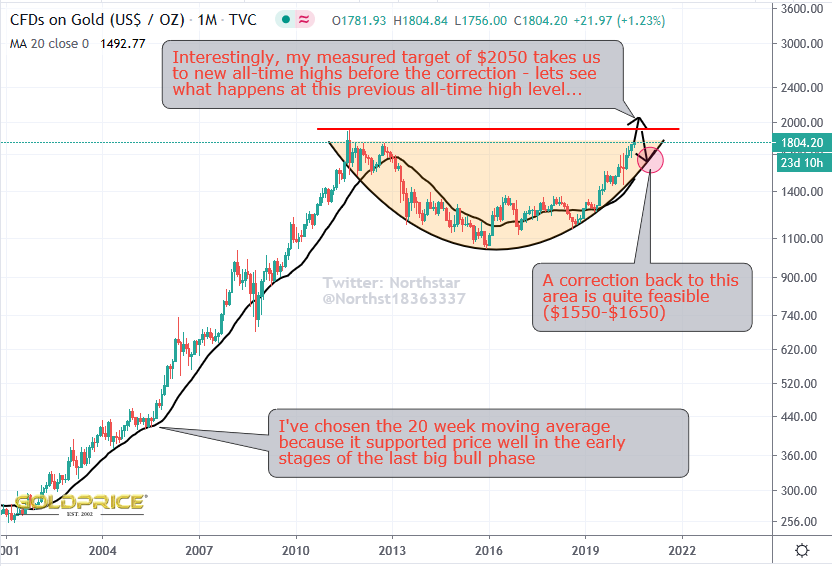
So how far will the next correction take us ? The most likely spot in my view is back to our friend the ‘arc’ support – it’s what brought us to this point after all.
And finally…
Once the inevitable correction has taken place, I believe the evidence as shown in my second chart above, remains true today – there is plenty of time to move to the next Fib extension level (I’ll be looking at this in the next few days/weeks), well beyond $2000. You can ride out the coming drop, or (like me) do your best to take some advantage from it, but the 8 year cycle low comes up in early 2024, so if we spend 6 months dropping to that low, it means we have until sometime in 2023, with price continuing to climb. The post-2024 drop, is likely to be followed by an epic bull run, but that’s for another time.
Trade the charts, not what you think/believe/hear – they’ll light the way and you shouldn’t go too far wrong.
Great insights and some wise councel! Appreciated.
Hope you find it all helpful Strider
Great summary. I love one stop shops.. like a book! This indeed will be a great story we can read in our olden days… talking about donkeys and rifles… ahhh.
and all the gold crazies on here…
Excellent overview, NS, of what can be a chaotic market. Thank you.