Bitcoin EW
From EW analyst weekend comment:
The following can be noted when looking back at Bitcoin’s behaviour during its previous strong falls in price:
The 94% fall in price from June to November 2011 was characterised by:
– Three clearly separate instances of RSI reaching oversold on the daily chart, separated by bounces.
– ADX did not remain very extreme for very long at all on the daily chart.
– On Balance Volume exhibited weak single bullish divergence at the low.
The 93% fall in price from November 2013 to February 2014 was characterised by:
– RSI reached oversold and remained deeply oversold for three weeks; at the low, there was only single weak bullish divergence with price.
– ADX remained very extreme for the last seven sessions to the low.
– At the low, On Balance Volume did not exhibit bullish divergence with price. It remained bearish and then exhibited further bearishness after the low as it continued to decline as price began to rise.
The 84% fall in price from December 2017 to December 2018 was characterised by:
– RSI reached deeply oversold and then exhibited double divergence with price.
– ADX reached very extreme 20 sessions prior to the low.
– At the low, On Balance Volume exhibits no bullish divergence with price; it turned with price.
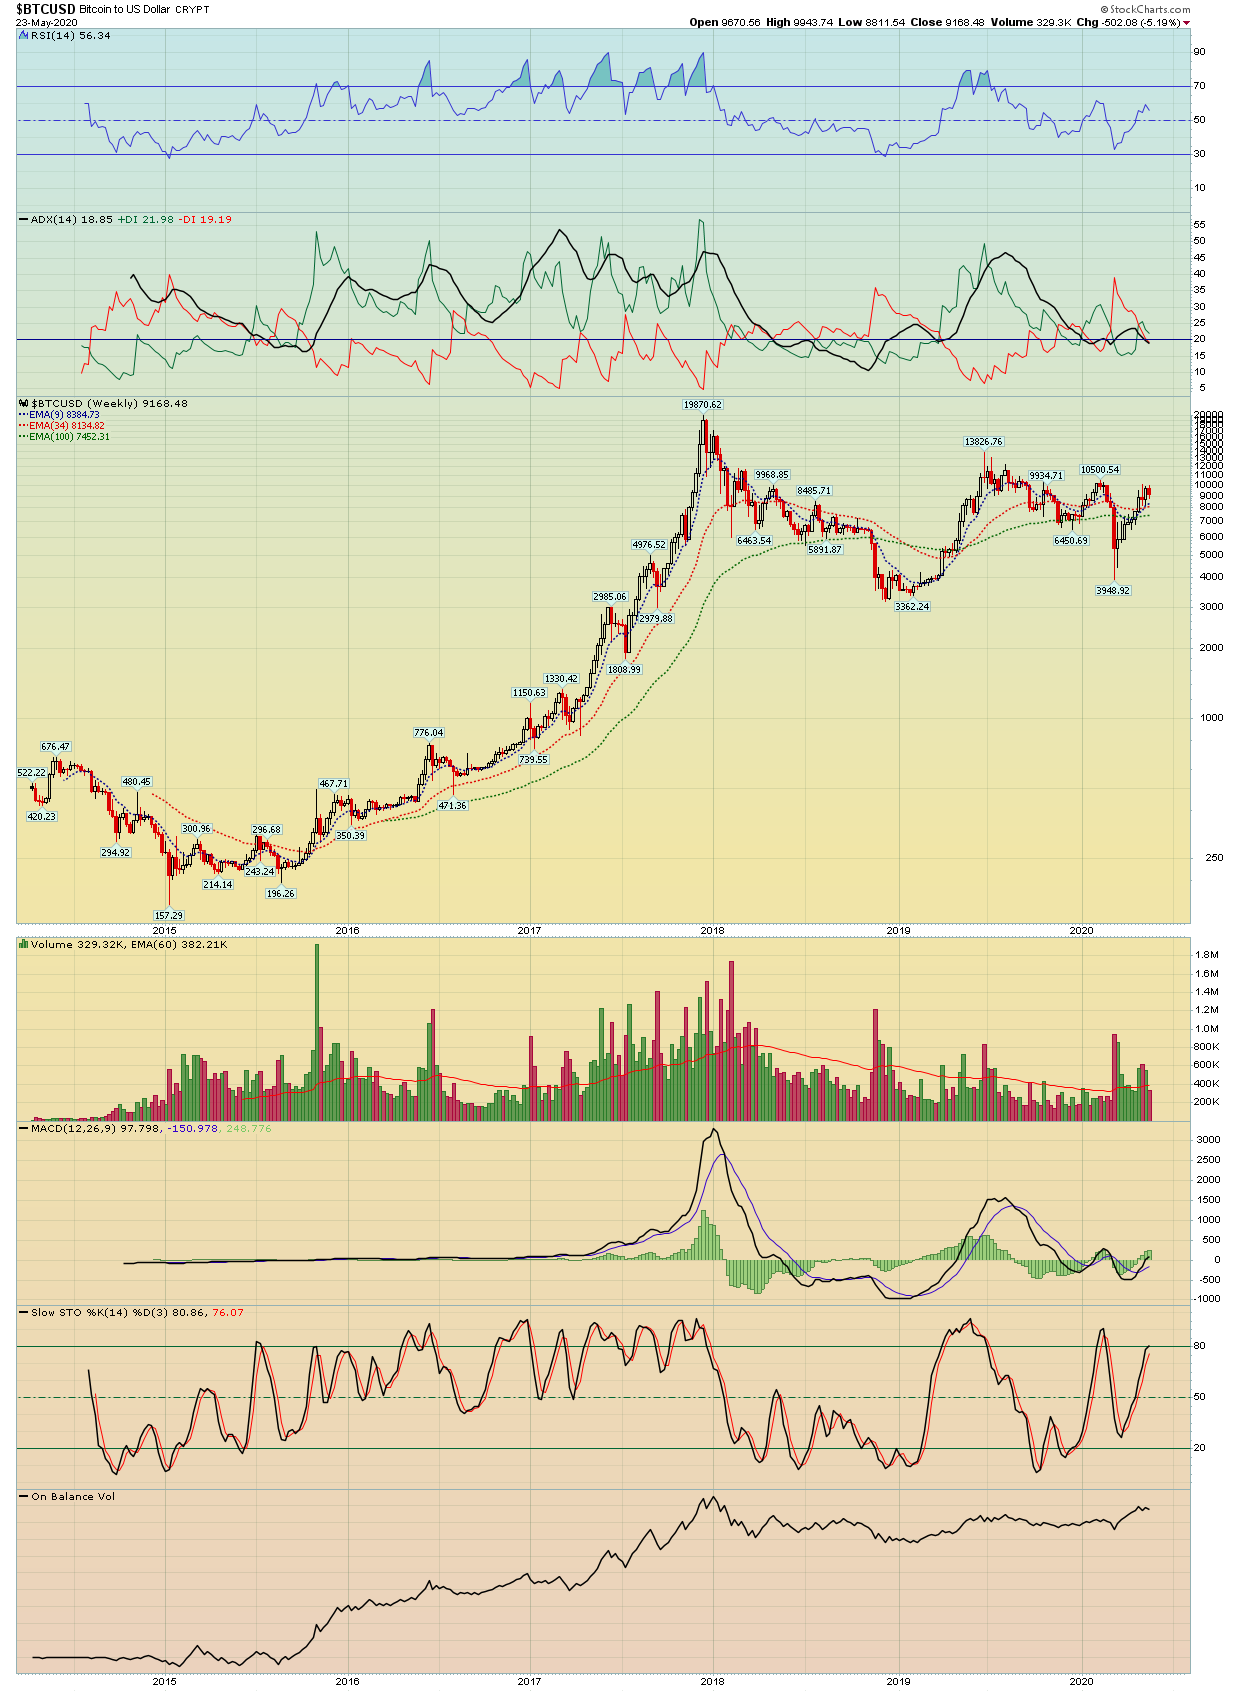
At this last low now on March 13th 2020, the following can be noted:
– There is no Bullish candlestick reversal pattern.
– An instance of single day bullish divergence between price and On Balance Volume.
– An instance of single day bullish divergence between price and RSI after RSI reached reasonably oversold.
– ADX had not reached extreme.
The low of March 13, 2020, is still inconclusive. It may only be an interim low; it may not be sustainable. A new swing high above 10,457.627 would be required for confidence that this low is sustainable.