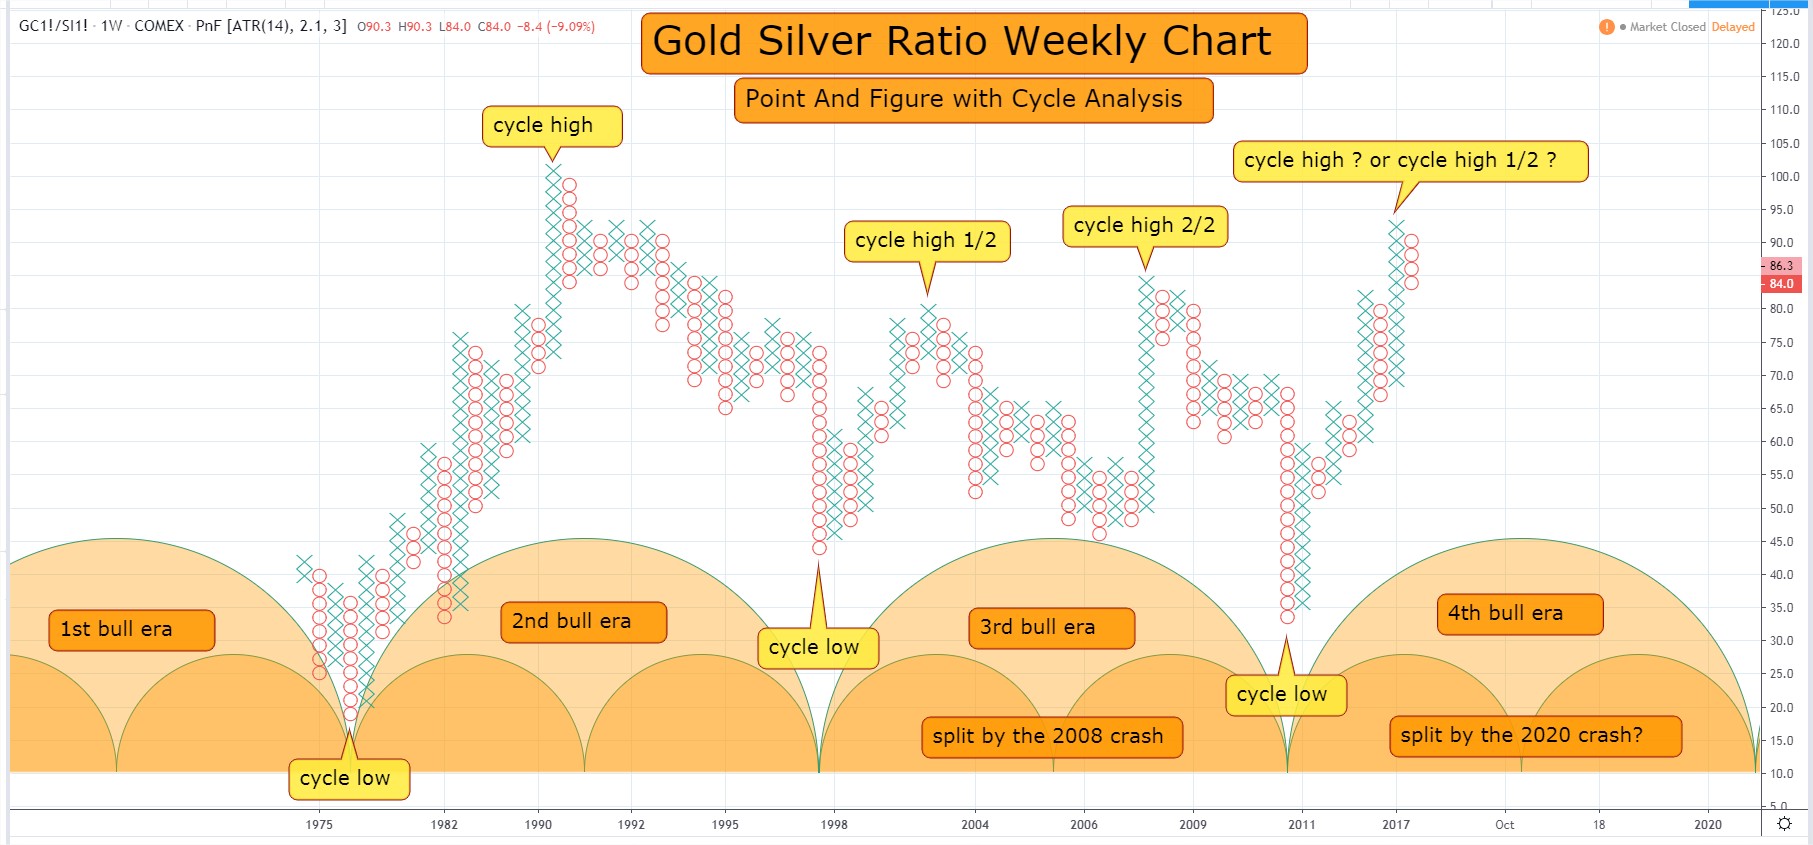
Point and Figure for Gold Silver Ratio (added previsions)
Picture is getting a lot clearer with cycles added to PnF weekly charts. The cycles just seem to fit right with time reduced charting…
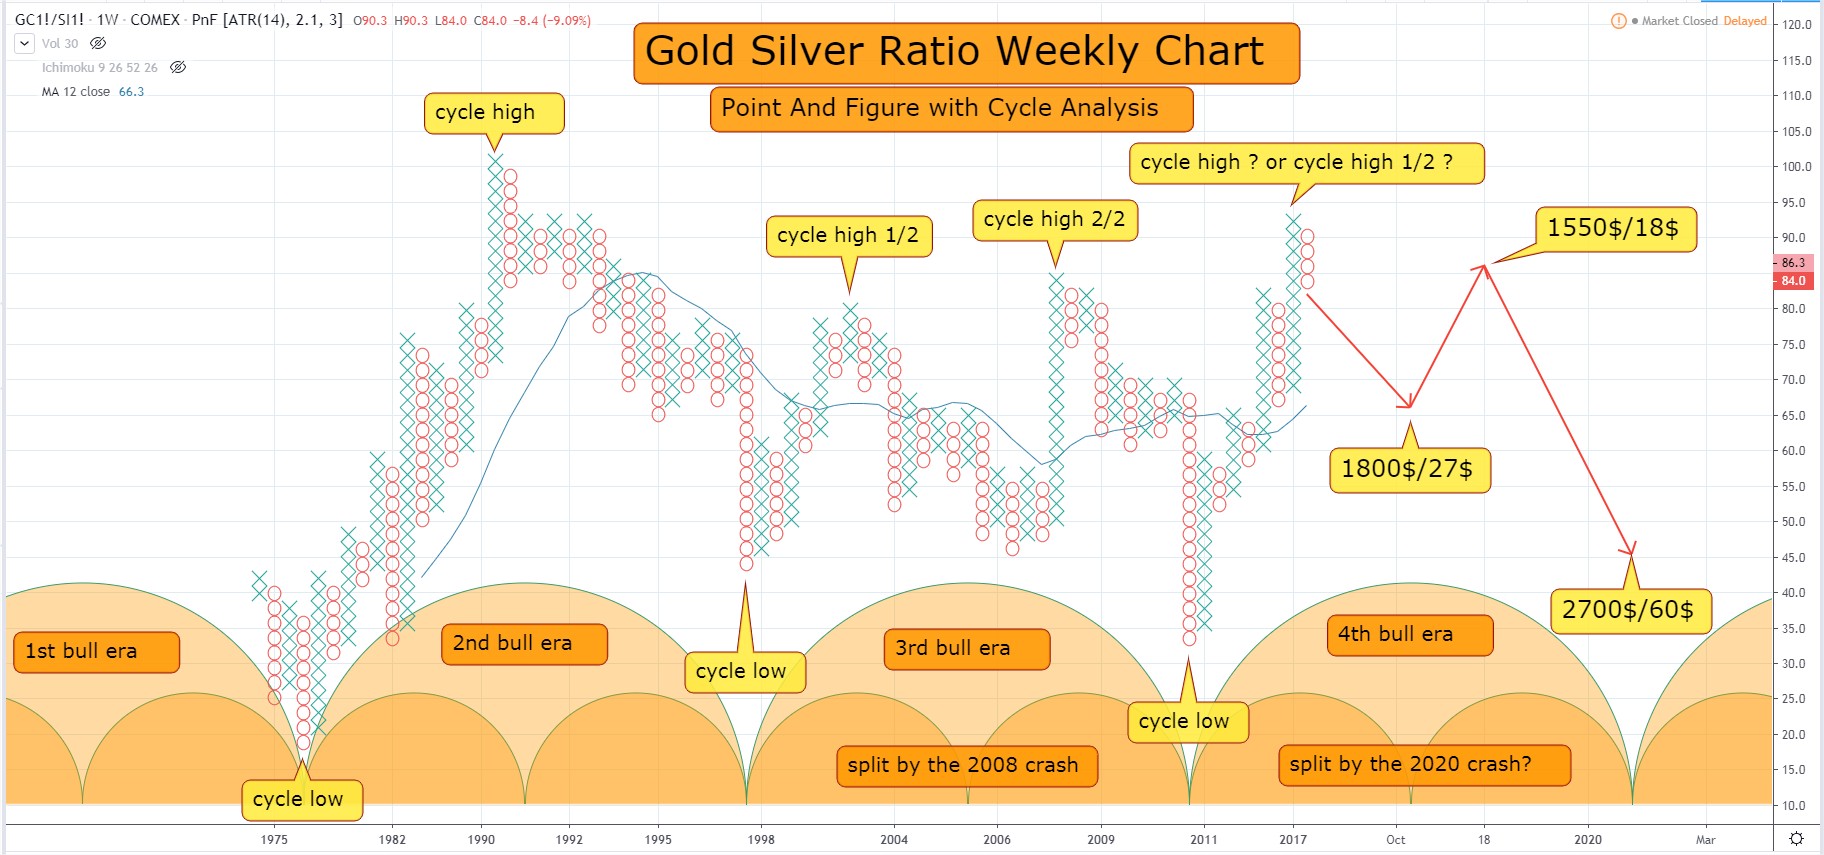
If we have already peaked.. then the current cycle might have two peaks… one now to bring as to a low of 1:66 ratio and 1800$/27$ … then another one after to bring gsr to 1:45 and 2700$/60$.
Gold and silver might correct severely when we get that second intermediate peak…
Edit: chart with previsions (not quite sure yet how that pull back is gonna look like… maybe need more vision on how chart morphs and where important support gets built)
Thanks for focusing in on the PNF charts Patrick. They are a great tool for all the reasons you mentioned. I think your idea of combining them with cycles is truly inspired. I’m looking forward to the platinum and palladium charts you promised ?
Thanks tshannon! Yes.. I’ll extend this type of analysis to the rest of the precious metals family !
Sorry, somehow the winking emoji turned into a question mark lol.
I’m thinking cycles fit very nicely on pnf because the focus is the price action cycle it must go through.. and not the time it takes to complete that rotation.
Gold and silver COMEX trading began in 1974. If you want prior data it may be available on LBMA London fix.
Great chart
I used to subscribe to a service that focused exclusively on the PNF’s that I first came across on the Stockcharts public chart list. He retired about five years ago and I was sorry to see him go. I learned a lot from him. It’s amazing how well they fit with cycle analysis. I think think you have invented a new sub category of TA lol.
Even the intermediate low of the 3rd bull era fits closely… and looks like current cycle will most likely be also split…
I’m guessing you say that because the current high is happening so early in the cycle?
Exactly. This pnf with cycles shows.. we can squeeze in for two minor cycles within the 4th bull era. Now the what question answered.. its a waiting game to answer the when.
Thanks.