Dollar Clues
The Rambus chart which Fully recently posted made me take another look at the dollar chart. I have to admit, my 80 (ish) target for the end of May clearly hasn’t happened. Price is behaving differently to the last two downturns after the dollar cycle peaks. Does this mean we haven’t peaked yet ? On the log chart, price has bounced off the long term downtrend line. On the non log chart it’s bounced off a zone of horizontal support. Dollar volatility appears to be subsiding, allowing the amplitude of each wave to decrease. There are two big reasons why I think the dollar top (for this cycle) is behind us. First, the moving averages have crossed over decisively, second time appears to have run out. You could, perhaps argue that we may have another 6-12 months before the dollar cycle peaks, but I don’t think so. Cycles experts will have a view on this based on the way cycles can be left or right translated.
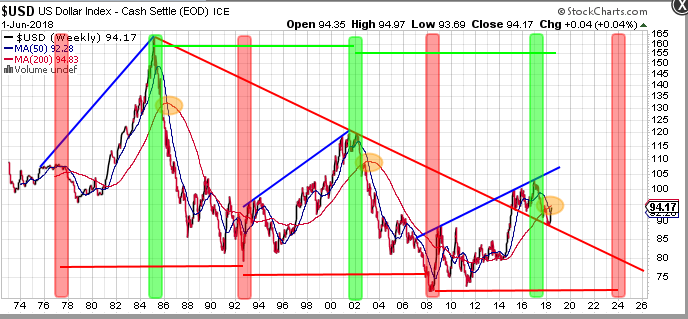
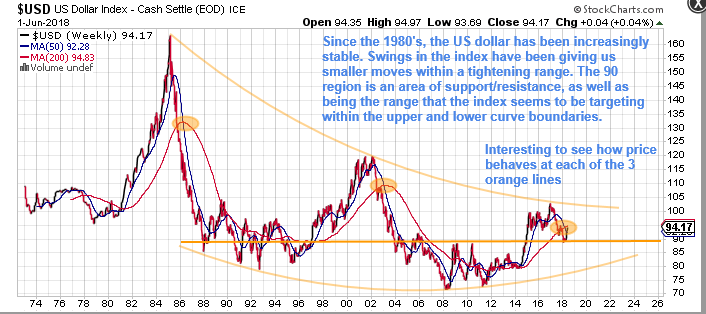
The red and green lines at the bottom and top of the above chart, are of equal length, so the green zone indicating a dollar top, could, perhaps be pushed to the right, but moving average crossover argues against this. However, as long as we remain above the red downtrend line, it’s not possible to turn completely bearish on the dollar. Here’s another way of looking at it…
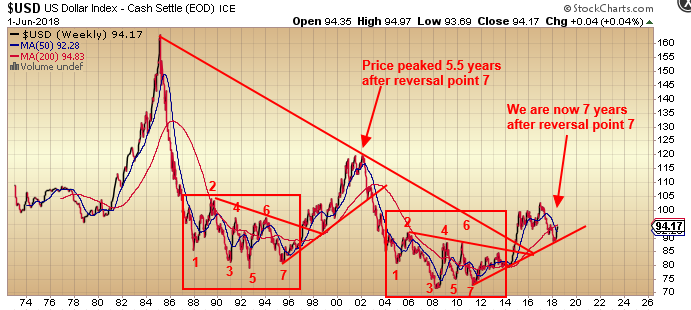
And finally, I took a look at the Rambus fractal…
My bearish view on the dollar is (for now) still in place. I expect the next wave down to breach that support line and, in doing so, make it clear that the dollar cycle is still working and we have several years of downside ahead of us. This needs to happen in the next 6 months, otherwise the scenario will be very different. Always keeping an open mind.
Very interesting take on the dollar, Northstar. Thank you for your charts.
Yes as always, thank you for the post. Does your commodity inflation scenario have to be accompanied by a fall in the dollar index (i.e. A rise in the euro primarily)? Why can’t commodity and PM price increases be indicated simply by their rise in dollar terms without having to bring the dollar index into the equation? I ask some variation of this question often because I’ve never really been able to understand the utility of the dollar index. Why is the dollar index a valuable tool to measure or predict or highlight rising or falling commodity prices in real terms? And isn’t that what we’re trying to do?
Spot on Curly Top. It’s gold which is the standard in my view. All paper currencies are devaluing against it. The relative dollar strength hasn’t bothered me too much lately, because I live in the UK, and when you convert to the dollar price of my mining shares to GBP my portfolio has held up very well in the last few months. It’s all relative – the proverbial ‘race to the bottom’.
Great work Northstar
I agree with you and Curly
The Dollar Index is just a Basket Case IMO
It is weighed against a random basket of currencies with huge weight on the Euro which is in its own right a basket case.
look at the HUGE drop in the 80s….Gold did Nothing in that period….so the opposite can also work. Dollar rise and Gold rise.
Exactly Fully. If the dollar climbs from here (I don’t think it will), it doesn’t necessarily mean gold can’t rise as well. It’s a complex relationship, but in general terms, I believe the cyclical nature of PMs and currencies will continue.