Gold – Who Knows?
I certainly wish I knew what gold would do over the next few weeks, not to mention the next two or three years. But no one knows that so all we can do is try to estimate where we are AND assess the probabilities of the path forward.
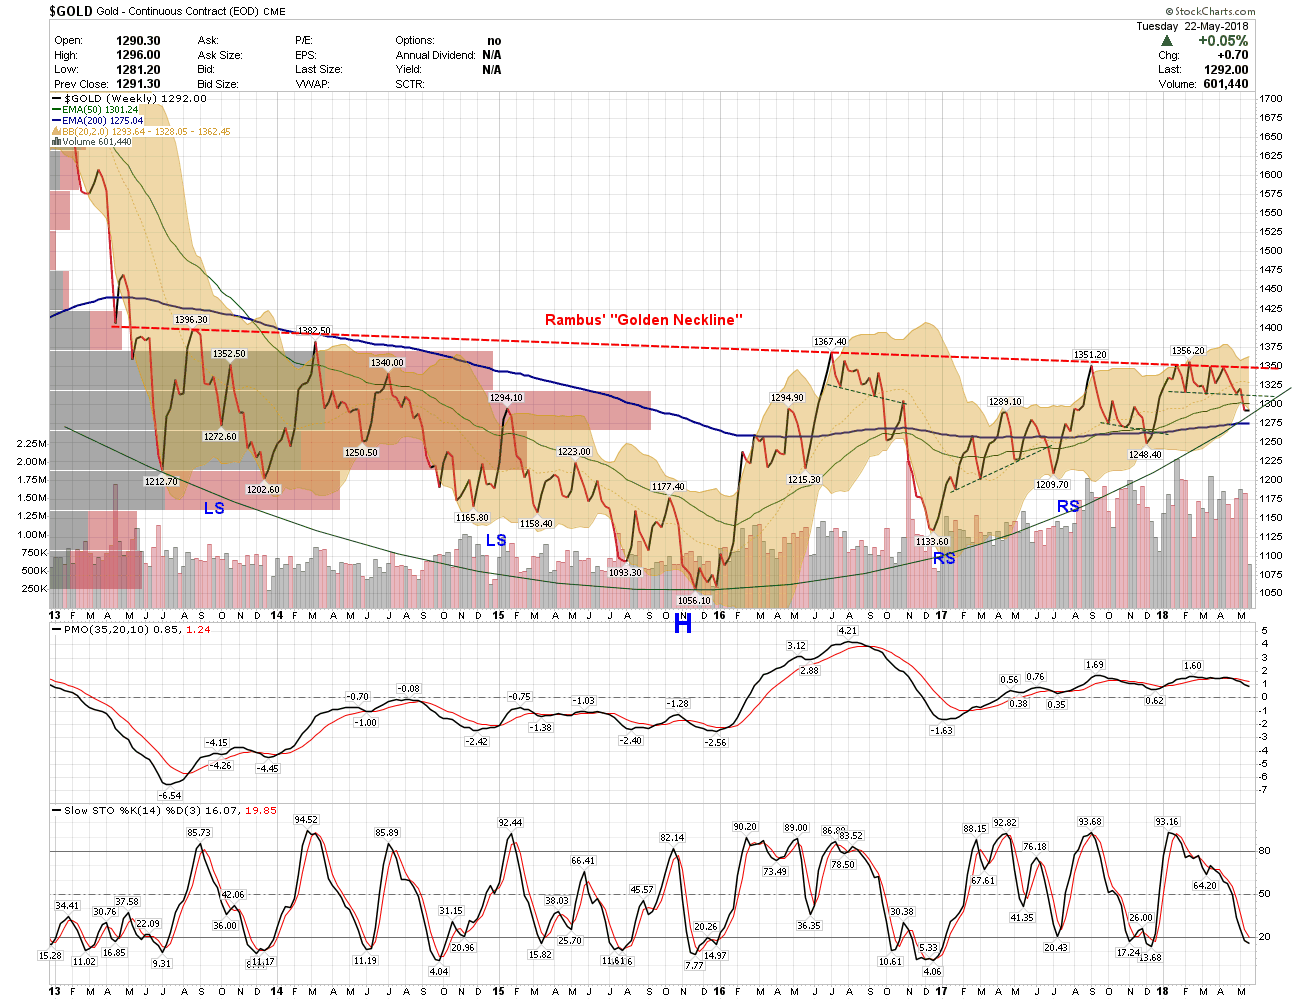
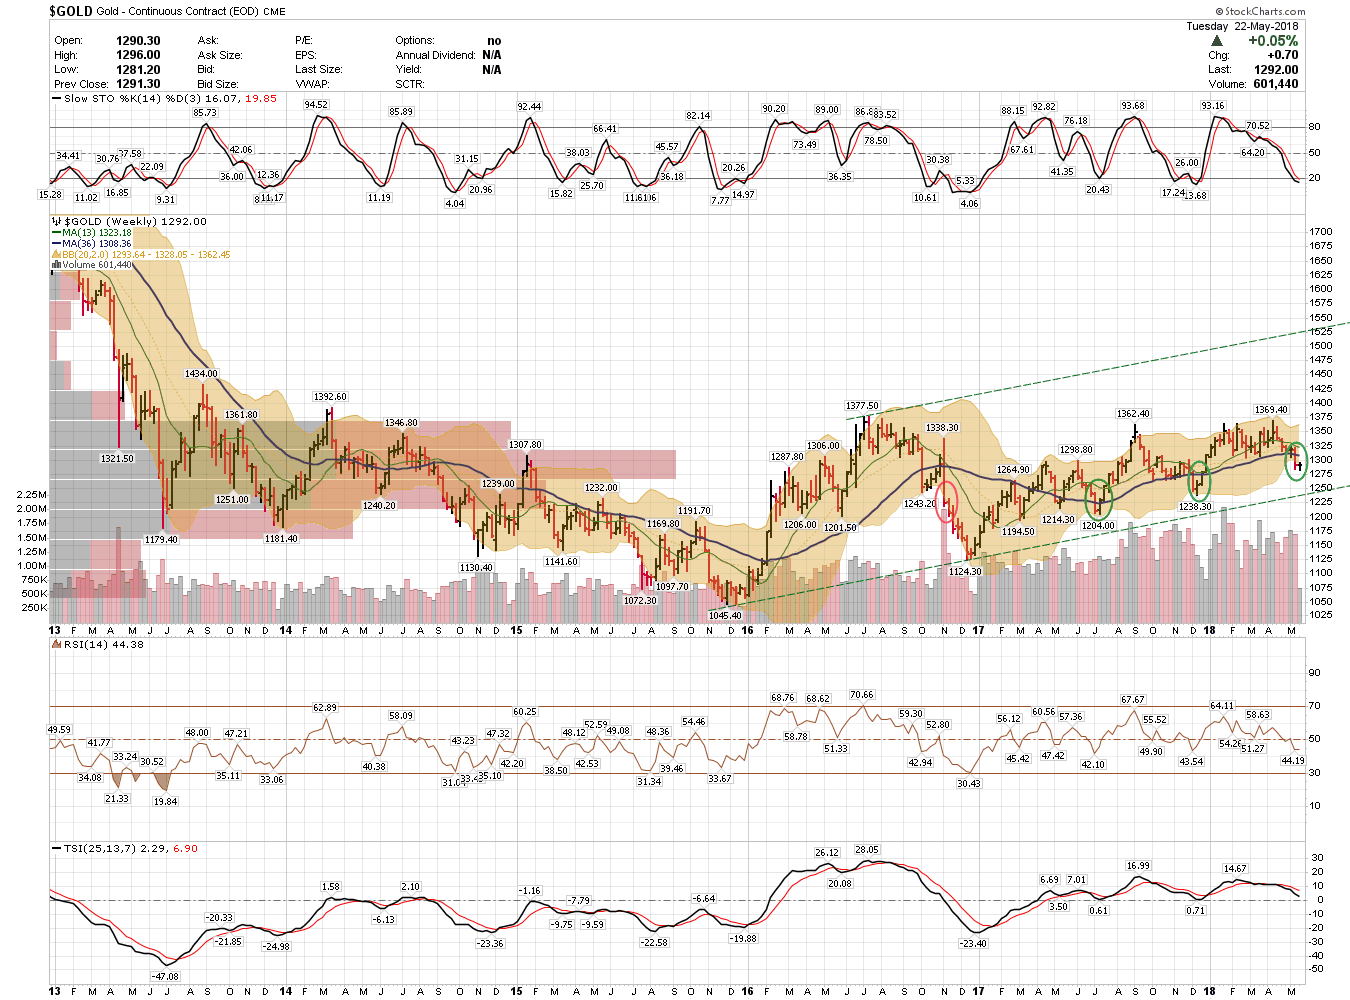
Here’s two charts of mine; they are simple, and while offering dire possibilities, neither has yet broken down. The PMO and TSI are both above their Zero lines and the Slow Stochastics are oversold without being embeded (a very bearish condition should it occur).
The COT report from last week shows the Comex Gold to be in balance, even slightly friendly though not outright bullish. Unless the T-Bonds begin another immediate downleg it would seem the gold market is set for a bounce. However, the longer it fails to do so the more threatening it becomes.
I’ve followed the work of Ira Epstein for about forty years, (whenever I can find it without paying for it!). One of the most accurate and helpful indicators he uses is “Price Counts”, proprietary to QT Info Systems. https://goldtadise.com/wp-content/uploads/2018/05/QT-Price-Counts-QT-Info-Systems-Inc.-Chicago-IL.pdf
Price Counts with chart for June Gold: June ’18 Comex Gold – DnSide Price Counts (04-06-18)
They show us essentially having met the first downside price count; if we don’t begin a rally very soon June Gold could easily drop to about $1270, with a trip down to about $1235 where the COT numbers should begin to look bullish. I would imagine that sentiment is already very negative and at $1235 it should be approaching white-knuckle levels.
******************************************************************************************************
Recently my professional friend produced a report on the precious metals that showed the probability for a “turn” in Gold this past week. That didn’t happen, though a one week variance is acceptable. However, it’s time for gold to rally above $1300 or it must be assumed the projected turn isn’t valid. Read his words from that piece carefully:
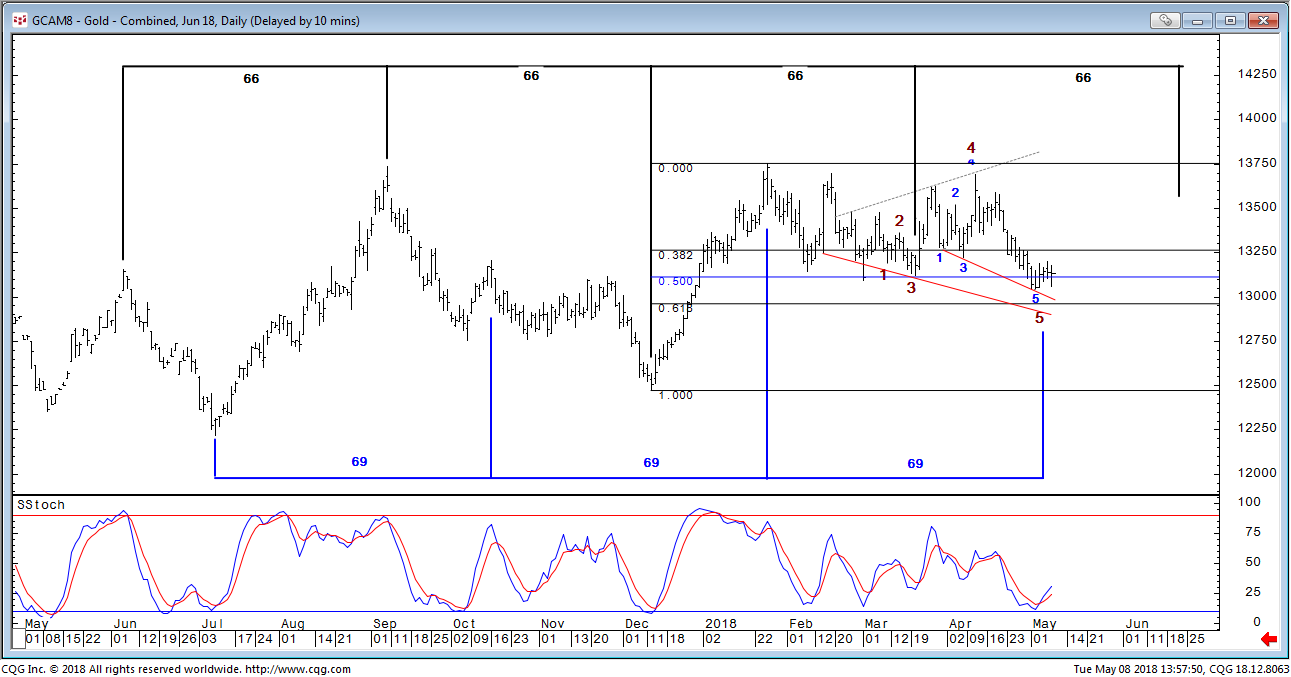
“Our focus on the gold chart above is the potential for two 5-point reversal patterns to be coincidentally terminating. Both have met their minimum structural requirements for a low with point -5 trading under its respective point-3 low. The pattern boundaries which are reached approximately 66% of the time define the range of $1,288-$1,298 basis the June contract. We are illustrating a couple of harmonics on this chart of which the 69- session appears particularly time relevant.”
Yesterday (May 21st) he sent this:
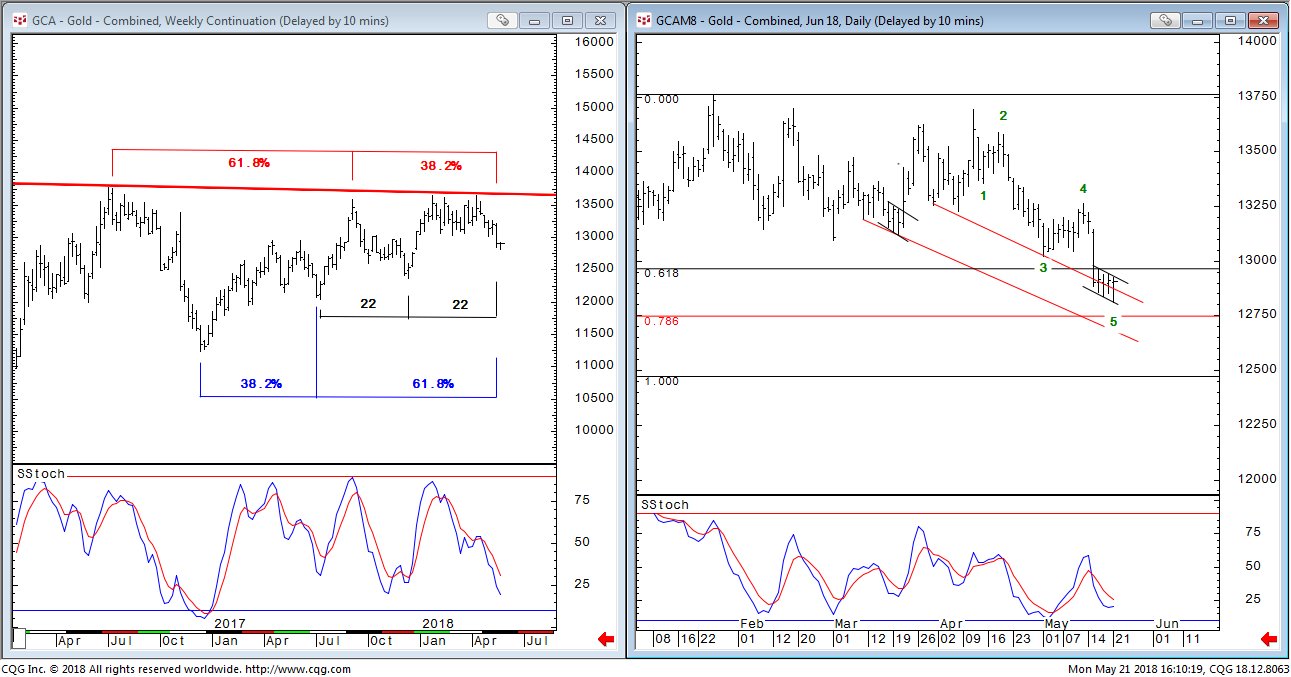
“Resistance initially 1305 but more meaningful at 1327 close basis. On the weekly chart, gold is within the 1 week permissible variance for a turn. June traded a new marginal low today and thereafter recovered. We have penciled in a 4 session down flag which in a down move can be a bullish turn in the making. The key is for price to exit basis the close above the pattern’s boundary. There was a smaller but similar pattern in 3rd week of March noted on the chart. We removed the 5-point numbers to more clearly show the current decline is a 5-wave movement. (The 5-point pattern boundaries remain as red declining lines). At 61.8% of the net decline of wave 1-2-3, a common wave relationship, wave-5 projects to 1284.80. I did the math manually today rather than using the software tools. Today’s low was 1281.20, acceptably close.”
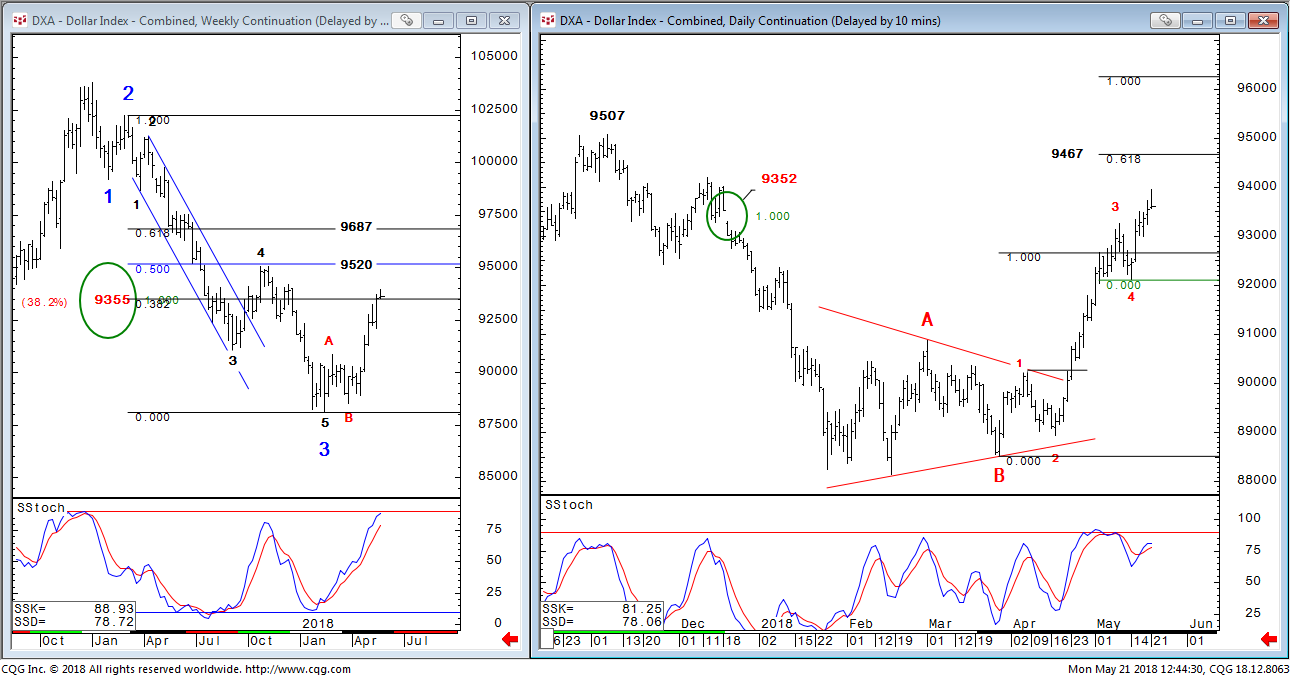
He also sent this concerning the US Dollar Index:
“Resistance reset to 9500 plus/minus. We are viewing the dollar as a wave-5 up within a 5-wave progression of a large C-wave up. One of the common targets for wave-5 is equality to wave-1 which is 93880. The high today was 93965, marginally above. You will note that there is a momentum divergence developing on the daily indicator which has not moved to new high readings with prices. This is a common correlation with 5th waves (but also with b-wave highs within a-b-c irregular corrections. Our label for 4 would be changed to a in that case with a b- high imminent. A wave-c down would follow.) Both of the foregoing cases favor a high. Higher levels are possible. At 9467 wave-5 would be 61.8% of the net gain of waves 1-2-3, also a common wave relationship. It is time to watch the dollar closely and the daily momentum indicator.”
I’m presently unhedged in my PM holdings and doubt this is a good place to add short hedges. If we get a weak rally up to $1298 – $1304 I may change my mind.
Thanks for this well balanced comprehensive post Booboo
I agree…Gold needs to at least bounce here
I see 1300 as strong resistance which at least should be retested
Great charts and post – Thank you!